Unlock a world of possibilities! Login now and discover the exclusive benefits awaiting you.
- Qlik Community
- :
- All Forums
- :
- QlikView App Dev
- :
- Re: How hide graphs with conditional presentation
- Subscribe to RSS Feed
- Mark Topic as New
- Mark Topic as Read
- Float this Topic for Current User
- Bookmark
- Subscribe
- Mute
- Printer Friendly Page
- Mark as New
- Bookmark
- Subscribe
- Mute
- Subscribe to RSS Feed
- Permalink
- Report Inappropriate Content
How hide graphs with conditional presentation
Hello, I've a dashboard for sales manager showing 15 different gauges rapresenting KPI of a commercial dept. cycling on different time dimension
So i've loaded inline list KPI
LOAD * INLINE [_metricsNo, _metricsKPI
1, %Sales on target
2, %Quantity
3, %Nr Customer
.....
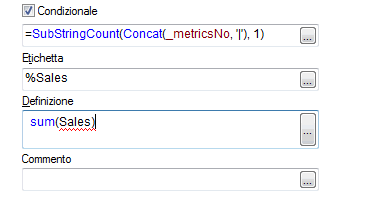
On expression ì've put the condition SubStringCount(Concat(_metricsNo, '|'), n°)
In this way i've build a list on metricsKPI and i can see all or focus on some selected KPIs.
I need a help how to use conditional presentation to show/hide objects since now, if deselected, i have only a error message that show an empty space with "kpi deselected".
Thank you
- « Previous Replies
-
- 1
- 2
- Next Replies »
Accepted Solutions
- Mark as New
- Bookmark
- Subscribe
- Mute
- Subscribe to RSS Feed
- Permalink
- Report Inappropriate Content
Try this
- Mark as New
- Bookmark
- Subscribe
- Mute
- Subscribe to RSS Feed
- Permalink
- Report Inappropriate Content
" ...On expression ì've put the condition SubStringCount(Concat(_metricsNo, '|'), n°) ...'
you mean on gauge ---> properties--->layout--->show--->conditional ??
- Mark as New
- Bookmark
- Subscribe
- Mute
- Subscribe to RSS Feed
- Permalink
- Report Inappropriate Content
try to paste there getselectedcount(_metricsNo)
- Mark as New
- Bookmark
- Subscribe
- Mute
- Subscribe to RSS Feed
- Permalink
- Report Inappropriate Content
No, on expression condition

- Mark as New
- Bookmark
- Subscribe
- Mute
- Subscribe to RSS Feed
- Permalink
- Report Inappropriate Content
Tks, but getselectedcount(_metricsNo) doesn't run
- Mark as New
- Bookmark
- Subscribe
- Mute
- Subscribe to RSS Feed
- Permalink
- Report Inappropriate Content
can you post a small sample file?
- Mark as New
- Bookmark
- Subscribe
- Mute
- Subscribe to RSS Feed
- Permalink
- Report Inappropriate Content
I hope this can be helpful.
- Mark as New
- Bookmark
- Subscribe
- Mute
- Subscribe to RSS Feed
- Permalink
- Report Inappropriate Content
Try this
- Mark as New
- Bookmark
- Subscribe
- Mute
- Subscribe to RSS Feed
- Permalink
- Report Inappropriate Content
Or perhaps this sort of view.
- Mark as New
- Bookmark
- Subscribe
- Mute
- Subscribe to RSS Feed
- Permalink
- Report Inappropriate Content
Hi beanz, trellis are gorgeus for this step, but we forecast that very soon we will develop analysis with container where gauges are combined with other graph for every KPI. Thank you very much
- « Previous Replies
-
- 1
- 2
- Next Replies »