Unlock a world of possibilities! Login now and discover the exclusive benefits awaiting you.
- Qlik Community
- :
- All Forums
- :
- QlikView App Dev
- :
- Re: How to use loaded data under a different field...
- Subscribe to RSS Feed
- Mark Topic as New
- Mark Topic as Read
- Float this Topic for Current User
- Bookmark
- Subscribe
- Mute
- Printer Friendly Page
- Mark as New
- Bookmark
- Subscribe
- Mute
- Subscribe to RSS Feed
- Permalink
- Report Inappropriate Content
How to use loaded data under a different field name without loading the data again
Hi,
I struggle to find a correct title...
I have sales in different files : Actuals 2011, Plan (budget) 2012, Actuals 2012, etc.
The load is as follow for all files:
Directory;
CrossTable(Month, Sales2012Plan, 4)
LOAD COUNTRY,
[PRODUCT NAME],
Year,
[Sales source],
Jan,
Feb,
Mar,
Apr,
May,
Jun,
Jul,
Aug,
Sep,
Oct,
Nov,
Dec
FROM
[APAC Sales Report - 2012 Plan.xls]
(biff, embedded labels, table is Database$);
what differs are the parts in red.
I have loaded those files to allow me to do graph 1 (see attachment)
Now as I wanted to do the graph 2, I could not find a way to do it with 2011 months followed by 2012 months.
So I reloaded all the exact same tables with the following changes in blue
for budget data :
Directory;
CrossTable(Monthactual, salesplan, 2)
LOAD COUNTRY,
[PRODUCT NAME],
Jan as [Jan-12],
Feb as [Feb-12],
Mar as [Mar-12],
Apr as [Apr-12],
May as [May-12],
Jun as [Jun-12],
Jul as [Jul-12],
Aug as [Aug-12],
Sep as [Sep-12],
Oct as [Oct-12],
Nov as [Nov-12],
Dec as [Dec-12]
FROM
[APAC Sales Report - 2012 Plan.xls]
(biff, embedded labels, table is Database$, filters(
Remove(Col, Pos(Top, 3)),
Remove(Col, Pos(Top, 3))
));
For actuals:
Directory;
CrossTable(Monthactual, salesactual, 2)
LOAD COUNTRY,
[PRODUCT NAME],
Jan as [Jan-12],
Feb as [Feb-12],
Mar as [Mar-12],
Apr as [Apr-12],
May as [May-12],
Jun as [Jun-12],
Jul as [Jul-12],
Aug as [Aug-12],
Sep as [Sep-12],
Oct as [Oct-12],
Nov as [Nov-12],
Dec as [Dec-12]
FROM
[APAC Sales Report - 2012 LBE.xls]
(biff, embedded labels, table is Database$, filters(
Remove(Col, Pos(Top, 3)),
Remove(Col, Pos(Top, 3))
));
I am convinced that there must be a much simpler way (as I have 12000 lines per table and I am loading now 2x 6 tables with some changes + crosstables) it takes for ever.
Please help.
Thnks
- « Previous Replies
-
- 1
- 2
- Next Replies »
- Mark as New
- Bookmark
- Subscribe
- Mute
- Subscribe to RSS Feed
- Permalink
- Report Inappropriate Content
you don't have to load it twice
moreover ... you shouldn't do it:)
try this way:
load all the tables (3?)
//for budget
CrossTable(Month, budget, 4)
LOAD COUNTRY,
[PRODUCT NAME],
Year,
[Sales source],
Jan,
Feb,
...
Dec
//for 2011
CrossTable(Month, actuals, 4)
LOAD COUNTRY,
[PRODUCT NAME],
Year,
[Sales source],
Jan,
Feb,
...
Dec
//for 2012
CrossTable(Month, actuals, 4)
LOAD COUNTRY,
[PRODUCT NAME],
Year,
[Sales source],
Jan,
Feb,
...
Dec
and modify your chart expression like this:
1st chart
dimension : Month
exp1 : sum(budget)
exp2 : sum(${<Year={2011}>}actuals)
exp3 : sum(${<Year={2012}>}actuals)
2nd chart
calculated dimension : Month&' - '&Year
exp1 : sum(budget)
exp2 : sum(actuals)
- Mark as New
- Bookmark
- Subscribe
- Mute
- Subscribe to RSS Feed
- Permalink
- Report Inappropriate Content
Hi,
thank you for your reply...
I have tried what you suggested (some of it before already) but for whatever reason it does not work for graph 2 and return an error for graph 1 for the exp2 and 3...
I attached the files for you to have a look directly...
Thanks
TD
- Mark as New
- Bookmark
- Subscribe
- Mute
- Subscribe to RSS Feed
- Permalink
- Report Inappropriate Content
As requested :
- Mark as New
- Bookmark
- Subscribe
- Mute
- Subscribe to RSS Feed
- Permalink
- Report Inappropriate Content
check this:
- Mark as New
- Bookmark
- Subscribe
- Mute
- Subscribe to RSS Feed
- Permalink
- Report Inappropriate Content
thanks it is a great start.
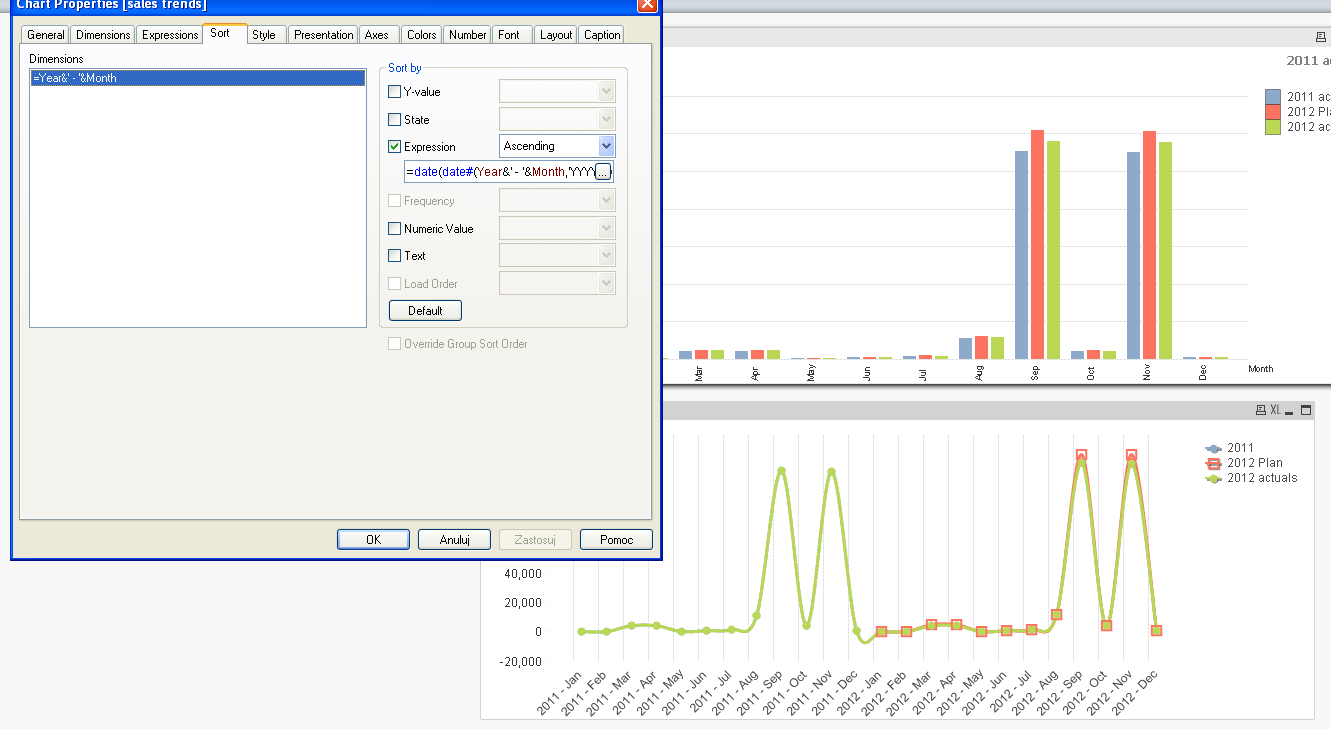
There is a problem with the bottom graph which does not order the dates in chronological order...
- Mark as New
- Bookmark
- Subscribe
- Mute
- Subscribe to RSS Feed
- Permalink
- Report Inappropriate Content
when i open this file the sort is ok:/
check if ther is only one condition for sort the dimension
:
=date(date#(Year&' - '&Month,'YYYY - MMM'))
- Mark as New
- Bookmark
- Subscribe
- Mute
- Subscribe to RSS Feed
- Permalink
- Report Inappropriate Content
I did, I am using QV 9, potential issue there ?
- Mark as New
- Bookmark
- Subscribe
- Mute
- Subscribe to RSS Feed
- Permalink
- Report Inappropriate Content
re-post your file please
- Mark as New
- Bookmark
- Subscribe
- Mute
- Subscribe to RSS Feed
- Permalink
- Report Inappropriate Content
I used yours the v3 you sent ! ah ah ah
- « Previous Replies
-
- 1
- 2
- Next Replies »