Unlock a world of possibilities! Login now and discover the exclusive benefits awaiting you.
- Qlik Community
- :
- All Forums
- :
- QlikView App Dev
- :
- Re: Count and Percent of Whole in One Bar Chart
- Subscribe to RSS Feed
- Mark Topic as New
- Mark Topic as Read
- Float this Topic for Current User
- Bookmark
- Subscribe
- Mute
- Printer Friendly Page
- Mark as New
- Bookmark
- Subscribe
- Mute
- Subscribe to RSS Feed
- Permalink
- Report Inappropriate Content
Count and Percent of Whole in One Bar Chart
Hello,
I'm visualizing a client report that previously showed the count of an attribute in one column, and the total percentage of its appearance in the next column.
I have a good top 5 bar chart going and can display either the counts or the percentages (by clicking the 'relative' button) - is there a way to show both?
Thanks.
- Tags:
- new_to_qlikview
Accepted Solutions
- Mark as New
- Bookmark
- Subscribe
- Mute
- Subscribe to RSS Feed
- Permalink
- Report Inappropriate Content
Not sure if I understood your question, but you can show the percentage as a column in the straight table using TOTAL in the expression. I have attached an example which limits the data to show only top 5 (Volume), but also shows the percentage of the total as a column. You can make top 5 based on either column.
- Mark as New
- Bookmark
- Subscribe
- Mute
- Subscribe to RSS Feed
- Permalink
- Report Inappropriate Content
Thank you - though I can't open the file on Personal edition, I'm going to create two different expressions and let the user cycle between count and percentage.
- Mark as New
- Bookmark
- Subscribe
- Mute
- Subscribe to RSS Feed
- Permalink
- Report Inappropriate Content
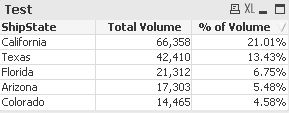
Oh no worries. Try this:
Create straight table in Chart Properties > Set dimension > Enter two expressions (for example):
Sum(Volume)
Sum(Volume)/Sum(TOTAL Volume)
Under dimension limits > Select 'Restrict which values are displayed' to show only top 5 > Deselect Show Others.
You get something like this:
- Mark as New
- Bookmark
- Subscribe
- Mute
- Subscribe to RSS Feed
- Permalink
- Report Inappropriate Content
Nice!
- Mark as New
- Bookmark
- Subscribe
- Mute
- Subscribe to RSS Feed
- Permalink
- Report Inappropriate Content
How do you convert those percentages to bars that fill that same percentage of the cell? I'm pretty sure it's a linear guage within the settigns , but I'm having trouble getting it to work.
Thanks in advance!