Unlock a world of possibilities! Login now and discover the exclusive benefits awaiting you.
- Qlik Community
- :
- All Forums
- :
- QlikView App Dev
- :
- Re: Show yearquarter as year on x-axis
- Subscribe to RSS Feed
- Mark Topic as New
- Mark Topic as Read
- Float this Topic for Current User
- Bookmark
- Subscribe
- Mute
- Printer Friendly Page
- Mark as New
- Bookmark
- Subscribe
- Mute
- Subscribe to RSS Feed
- Permalink
- Report Inappropriate Content
Show yearquarter as year on x-axis
Hi,
I try to make a graph which has yearquarter on the x-axis but displays only year instead of yearquarter.
For year 2010 there are four categories 2010-Q1, 2010-Q2, 2010-Q3 and 2010-Q4. I want to show the four values corresponding to the the quarters but on the x-axis I only want to show 2010.
How can I achieve this?
- Mark as New
- Bookmark
- Subscribe
- Mute
- Subscribe to RSS Feed
- Permalink
- Report Inappropriate Content
You have to play a bit trick. As you want four values, you must have four different values in x-axis here to. So do this:
use calculated dimension and write expression like :
=If(Period='2010-q1','2010',If(Period='2010-q1','2010 '.....)) likewise. thought the x-axis values would be different '2010', '2010 ', '2010 ','2010 ' (difference in space)-- user would see as 2010 only.
Or you might have to change a bit of trick as per your need.
Regards,
tresesco
- Mark as New
- Bookmark
- Subscribe
- Mute
- Subscribe to RSS Feed
- Permalink
- Report Inappropriate Content
i'm not sure what you want to achieve..
could you send an excel sample?
- Mark as New
- Bookmark
- Subscribe
- Mute
- Subscribe to RSS Feed
- Permalink
- Report Inappropriate Content
He treseco,
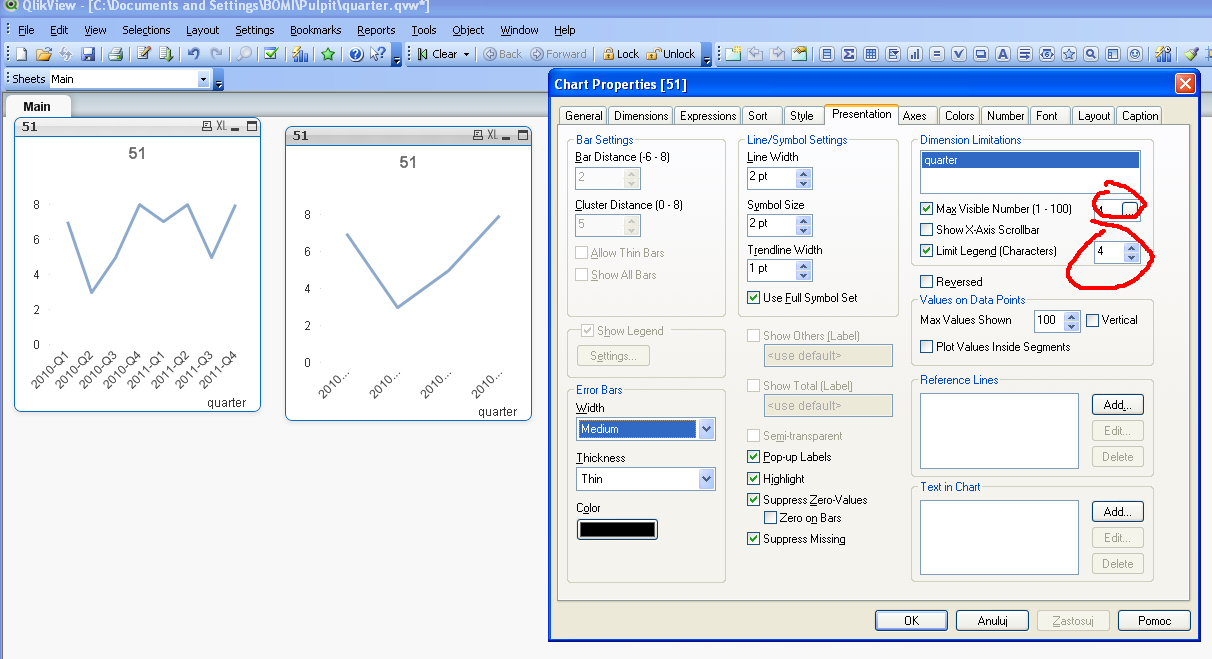
Thanks for the reply, this is not exactly what I want. I want to show 2010 only once.
I've attached two images, one how the situation is right now and one how I want it to be.
- Mark as New
- Bookmark
- Subscribe
- Mute
- Subscribe to RSS Feed
- Permalink
- Report Inappropriate Content
try to combine it by:
- Mark as New
- Bookmark
- Subscribe
- Mute
- Subscribe to RSS Feed
- Permalink
- Report Inappropriate Content
solutrion presented above is not exact solution:/
you can try to prepare two charts like in qvw attached below
- Mark as New
- Bookmark
- Subscribe
- Mute
- Subscribe to RSS Feed
- Permalink
- Report Inappropriate Content
Did you try year function with the period field in the calculated dimension?
Like Year(YourPeriodFiled), if the format of the field is okay, it would generate yearly data.
Regards,
tresesco
- Mark as New
- Bookmark
- Subscribe
- Mute
- Subscribe to RSS Feed
- Permalink
- Report Inappropriate Content
He Tresco,
I already tried what you suggested, the problem is that i than onlly get 3 values. The sum of all the quarters in 2010, the sum of all the quarters in 2011 and the sum of all the quaters in 2012.
Pari your suggestion seems to be a solution.
Although i was hoping on a more elegant solution. I was trying the dual function but unfortunately I couldn't get it to work properly.
- Mark as New
- Bookmark
- Subscribe
- Mute
- Subscribe to RSS Feed
- Permalink
- Report Inappropriate Content
Use dual function. Keep all numeric data and assign years as text representation.
QlikView distinguish values by numeric value.
=Dual(Year(YourPeriodFiled), YourPeriodFiled)
But this will reapeat year labels 
If you don't like it, you can upgrade this trick:
=Dual(if(YourPeriodFiled=SecondQuarter, Year(YourPeriodFiled), ''), YourPeriodFiled)
"YourPeriodFiled=SecondQuarter" <- its "pseudocode", you should write the corresponding expression.
upd:
I've just tried... awesome.