Unlock a world of possibilities! Login now and discover the exclusive benefits awaiting you.
- Qlik Community
- :
- All Forums
- :
- QlikView App Dev
- :
- Re: bar chart
- Subscribe to RSS Feed
- Mark Topic as New
- Mark Topic as Read
- Float this Topic for Current User
- Bookmark
- Subscribe
- Mute
- Printer Friendly Page
- Mark as New
- Bookmark
- Subscribe
- Mute
- Subscribe to RSS Feed
- Permalink
- Report Inappropriate Content
bar chart
Hi all,
I have a question in bar chart,in my bar chart i taken a month is a dimension(x-axis) with 2 expressions(2 bars).1st expresion(1 bar) is sum(value) for max(year).2nd expresion(2nd bar) is sum(value) for max(year)-1.please find the attacment.
The bar cahrt showing correctly, but i want to eliminate the prev year bars where the month values is null in current year.i wnat to show the bar chart like this
If again the values will be uploaded in sept month and so on the prev year bars of months will appear.
Can anyone have solution for this.please help me.
regards,
baru
- « Previous Replies
-
- 1
- 2
- Next Replies »
Accepted Solutions
- Mark as New
- Bookmark
- Subscribe
- Mute
- Subscribe to RSS Feed
- Permalink
- Report Inappropriate Content
Use this as dimension:
=aggr(if(sum({$<year ={$(=Max(year))}>}value)<>0, month), month)
- Mark as New
- Bookmark
- Subscribe
- Mute
- Subscribe to RSS Feed
- Permalink
- Report Inappropriate Content
Use this as dimension:
=aggr(if(sum({$<year ={$(=Max(year))}>}value)<>0, month), month)
- Mark as New
- Bookmark
- Subscribe
- Mute
- Subscribe to RSS Feed
- Permalink
- Report Inappropriate Content
Hi whiteline,
Thanks for the solution,it is showing correctly.
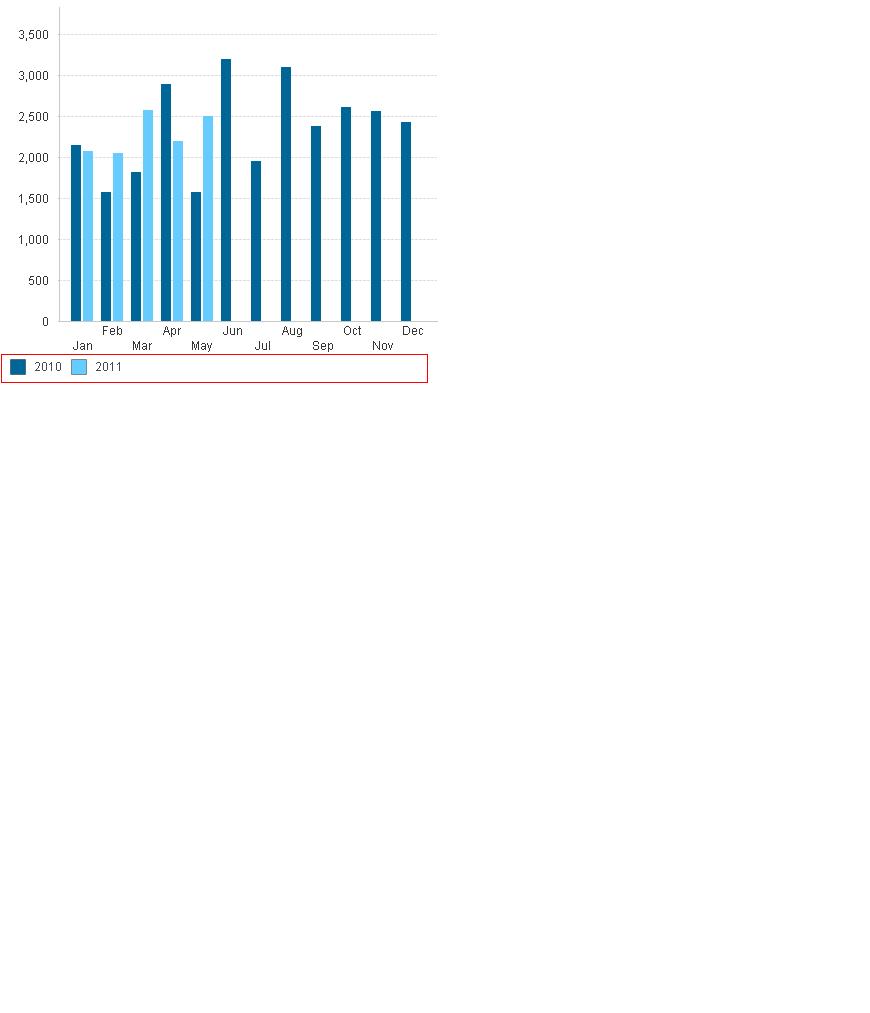
I have 1 more question,how can we represent legend(2011 Budget,2011 Actual) like in the following image,
regards,
baru
- Mark as New
- Bookmark
- Subscribe
- Mute
- Subscribe to RSS Feed
- Permalink
- Report Inappropriate Content
Sorry, can't see the image.
Append it as an attachment.
I guess you want to parametrize expression labels like this:
=Max(year) & ' Budget'
instead of 'prev year'
and
=Max(year) & ' Actual'
instead of 'cur.year'
- Mark as New
- Bookmark
- Subscribe
- Mute
- Subscribe to RSS Feed
- Permalink
- Report Inappropriate Content
Hi whiteline,
no i am not asking about the legent captions.i want represent legend as horizontal position in my chart.Like..
regards,
baru
- Mark as New
- Bookmark
- Subscribe
- Mute
- Subscribe to RSS Feed
- Permalink
- Report Inappropriate Content
The same problem with images.
Could you attach them as files ?
- Mark as New
- Bookmark
- Subscribe
- Mute
- Subscribe to RSS Feed
- Permalink
- Report Inappropriate Content
Hi Baru,
Under the axes tab, we can change our legend position through "Dimension Axis" part.
Regards,
Kabilan K.
- Mark as New
- Bookmark
- Subscribe
- Mute
- Subscribe to RSS Feed
- Permalink
- Report Inappropriate Content
Hi whiteline,
i am sorry for inconvenience.please see the above image with red mark.I want legend in horizontal view in chart.above one is the example.
regards,
baru
- Mark as New
- Bookmark
- Subscribe
- Mute
- Subscribe to RSS Feed
- Permalink
- Report Inappropriate Content
Select this chart (click on caption).
Press and hold Ctrl+Shift (you should see red rectangles).
Move the legend rectangle with the mouse.
- Mark as New
- Bookmark
- Subscribe
- Mute
- Subscribe to RSS Feed
- Permalink
- Report Inappropriate Content
Can u give a clear picture?
Regards,
Kabilan
- « Previous Replies
-
- 1
- 2
- Next Replies »