Unlock a world of possibilities! Login now and discover the exclusive benefits awaiting you.
- Qlik Community
- :
- All Forums
- :
- QlikView App Dev
- :
- Re: Reading from QVD file data discrepancy
- Subscribe to RSS Feed
- Mark Topic as New
- Mark Topic as Read
- Float this Topic for Current User
- Bookmark
- Subscribe
- Mute
- Printer Friendly Page
- Mark as New
- Bookmark
- Subscribe
- Mute
- Subscribe to RSS Feed
- Permalink
- Report Inappropriate Content
Reading from QVD file data discrepancy
Hi to everybody,
I generate a QVD file in an independent qvw file with the following script:
master:
LOAD [Serial Number],
[Year/Month],
If(Right([Year/Month],2)='11' or Right([Year/Month],2)='12',Left([Year/Month],4)+1,Left([Year/Month],4)) as FY,
Right([Year/Month],2) as Month,
makedate(Left([Year/Month],4),Right([Year/Month],2)) as DateComparison,
if(Right([Year/Month],2)='11' or Right([Year/Month],2)='12' or Right([Year/Month],2)='01','Q1',
if(Right([Year/Month],2)='02' or Right([Year/Month],2)='03' or Right([Year/Month],2)='04','Q2',
if(Right([Year/Month],2)='05' or Right([Year/Month],2)='06' or Right([Year/Month],2)='07','Q3',
if(Right([Year/Month],2)='08' or Right([Year/Month],2)='09' or Right([Year/Month],2)='10','Q4')))) as Quarter,
if(Right([Year/Month],2)='11' or Right([Year/Month],2)='12' or Right([Year/Month],2)='01' or Right([Year/Month],2)='02' or Right([Year/Month],2)='03' or Right([Year/Month],2)='04','H1',
if(Right([Year/Month],2)='05' or Right([Year/Month],2)='06' or Right([Year/Month],2)='07' or Right([Year/Month],2)='08' or Right([Year/Month],2)='09' or Right([Year/Month],2)='10','H2')) as Half,
Upper(left(left(MonthName(makedate(Left([Year/Month],4),Right([Year/Month],2))),3),1))& right(left(MonthName(makedate(Left([Year/Month],4),Right([Year/Month],2))),3),2) as MName,
[End User NR],
[End User Name],
[Customer NR],
[Customer Name],
upper([Sub-Region]) as [Sub-Region],
Country,
[Customer ID],
Ownership,
Segment,
[Series Grouping] as [Family Type],
[Product Line] as [Press Description],
[Press Group] as [Product Line],
Impressions,
Revenue,
Cogs,
[Restated Revenue] as [Restated Revenue SN],
Click,
[Serial Number]&Country as LinkSNCountry,
[Serial Number]&[Year/Month] as ROWID
FROM
[..\Data\Indigo Supplies Cube\Rawdata.xlsx]
(ooxml, embedded labels, table is [Historic Rawdata by SN]);
store master INTO [..\Data\Indigo Supplies Cube\rawdata.qvd]
(qvd);
drop table master;
Later, on another file I use the following script to read from the previously generated QVD file:
master:
LOAD
[Serial Number],
[Year/Month],
FY,
Month,
DateComparison,
Quarter,
Half,
MName,
[End User NR],
[End User Name],
[Customer NR],
[Customer Name],
[Sub-Region],
Country,
[Customer ID],
Ownership,
Segment,
[Family Type],
[Press Description],
[Product Line],
Impressions,
Revenue,
Cogs,
[Restated Revenue SN],
Click,
LinkSNCountry,
ROWID
FROM
[..\Data\Indigo Supplies Cube\rawdata.qvd]
(qvd);
I don't understand why, but when I read the data from the QVD file instead of the Excel file (the one used to create the QVD), there seems to be a discrepancy between the information because while the information shown in many of the charts remains the same,at least one changes with no reason.
I don't know if I'm skipping some relevant syntax regarding the store or the load from QVD files; or maybe it's a problem of the chart. But when reading from the Excel file directly everything seems to be correct.
Thanks for taking your time to read this.
- Mark as New
- Bookmark
- Subscribe
- Mute
- Subscribe to RSS Feed
- Permalink
- Report Inappropriate Content
Could you post some detail on the actual difference you are seeing in the chart?
-Rob
- Mark as New
- Bookmark
- Subscribe
- Mute
- Subscribe to RSS Feed
- Permalink
- Report Inappropriate Content
Hey Rob,
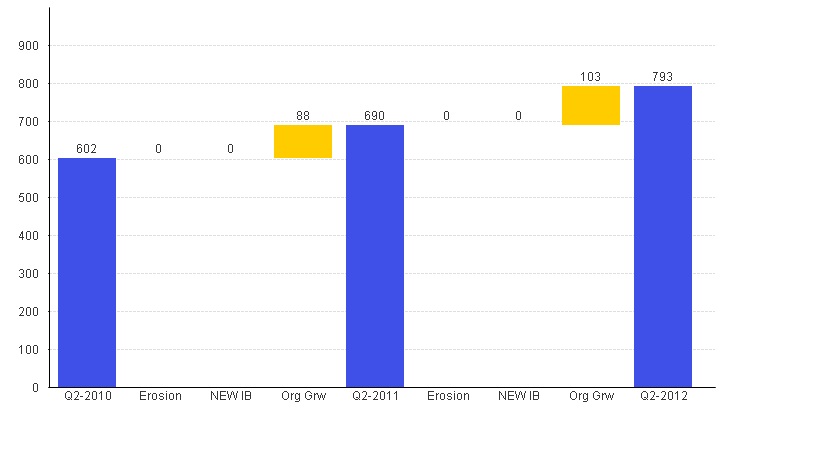
Here is what it was supposed to be showing (BEFORE):
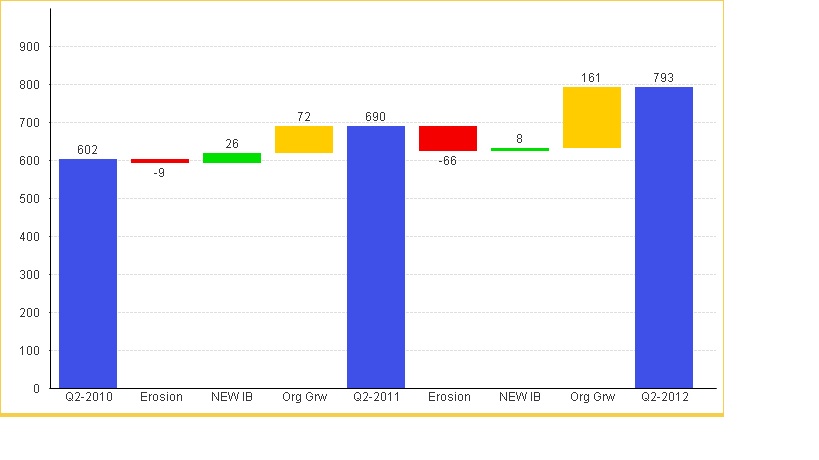
And here goes what it actually shows after reading from the qvd:
The expressions are as follows (for the 4 ones on the right):
Erosion:
0-
sum({<DateComparison={">=$(=vQuarterEndDatePreviousYear2) <=$(=vQuarterEndDatePreviousYear)"},
[Serial Number]=e({<DateComparison={">=$(=vQuarterEndDatePreviousYear) <=$(=vQuarterEndDate)"}>} [Serial Number])>} Impressions)
/1000000
NEW IB:
sum
({<DateComparison={">=$(=vQuarterEndDatePreviousYear) <=$(=vQuarterEndDate)"},
[Serial Number]=e({<DateComparison={">=$(=vQuarterEndDatePreviousYear2) <=$(=vQuarterEndDatePreviousYear)"}>} [Serial Number])>} Impressions)
/1000000
Org Grw:
(
sum({<FY={$(=FYEnd)},Quarter={$(=QuarterEnd)}>}Impressions)
-
sum({<FY={$(=FYEnd-1)},Quarter={$(=QuarterEnd)}>}Impressions)
-
sum({<DateComparison={">=$(=vQuarterEndDatePreviousYear) <=$(=vQuarterEndDate)"},
[Serial Number]=e({<DateComparison={">=$(=vQuarterEndDatePreviousYear2) <=$(=vQuarterEndDatePreviousYear)"}>} [Serial Number])>} Impressions)
+
sum({<DateComparison={">=$(=vQuarterEndDatePreviousYear2) <=$(=vQuarterEndDatePreviousYear)"},
[Serial Number]=e({<DateComparison={">=$(=vQuarterEndDatePreviousYear) <=$(=vQuarterEndDate)"}>} [Serial Number])>} Impressions)
)
/1000000
Q2-2012:
sum
({<FY={$(=FYEnd)},Quarter={$(=QuarterEnd)}>}Impressions)
/1000000
And here goes the expressions for the variables:
vQuarterEndDate=
If(QuarterEnd='Q1', MonthEnd(MakeDate(FYEnd,01)),
If(QuarterEnd='Q2', MonthEnd(MakeDate(FYEnd,04)),
If(QuarterEnd='Q3', MonthEnd(MakeDate(FYEnd,07)),
If(QuarterEnd='Q4', MonthEnd(MakeDate(FYEnd,10))
))))
vQuarterEndDatePreviousYear=
If(QuarterEnd='Q1', MonthEnd(MakeDate(FYEnd-1,01)),
If(QuarterEnd='Q2', MonthEnd(MakeDate(FYEnd-1,04)),
If(QuarterEnd='Q3', MonthEnd(MakeDate(FYEnd-1,07)),
If(QuarterEnd='Q4', MonthEnd(MakeDate(FYEnd-1,10))
))))
vQuarterEndDatePreviousYear2=
If(QuarterEnd='Q1', MonthEnd(MakeDate(FYEnd-2,01)),
If(QuarterEnd='Q2', MonthEnd(MakeDate(FYEnd-2,04)),
If(QuarterEnd='Q3', MonthEnd(MakeDate(FYEnd-2,07)),
If(QuarterEnd='Q4', MonthEnd(MakeDate(FYEnd-2,10))
))))
vQuarterEndDatePreviousYear3=
If(QuarterEnd='Q1', MonthEnd(MakeDate(FYEnd-3,01)),
If(QuarterEnd='Q2', MonthEnd(MakeDate(FYEnd-3,04)),
If(QuarterEnd='Q3', MonthEnd(MakeDate(FYEnd-3,07)),
If(QuarterEnd='Q4', MonthEnd(MakeDate(FYEnd-3,10))
))))
I know that this is quite complicated to understand, but it's ever more weird why the qlikview changes the data.
Maybe it has relation with the variables, but I have checked the values on both of the versions and they have the same value.
Thank you for your time.
-Jon
- Mark as New
- Bookmark
- Subscribe
- Mute
- Subscribe to RSS Feed
- Permalink
- Report Inappropriate Content
Try to simplify identifying the differences. The chart makes it a bit more complex.
1. Same/different number of rows in file vs qvd method? If different, what rows are missing?
2. Total the numbers such as Impressions in each file. same or different? If different, try the same comparison grouped by dimension.
-Rob
- Mark as New
- Bookmark
- Subscribe
- Mute
- Subscribe to RSS Feed
- Permalink
- Report Inappropriate Content
Hi Rob and thanks for your time,
1. I have the same number of rows on both files.
2. The total Impressions is also the same, but I get different values if I check, for example, the value of:
sum({<[Serial Number]=e({<DateComparison={">=$(=vQuarterEndDatePreviousYear) <=$(=vQuarterEndDate)"}>} )>} Impressions)
On what I understand, it has to have some relation with the serial numbers, but I have exactly the same (in values and number of SN).
I will recheck everything later, but this thing is driving me crazy.
Thanks again!