Unlock a world of possibilities! Login now and discover the exclusive benefits awaiting you.
- Qlik Community
- :
- All Forums
- :
- QlikView App Dev
- :
- Re: How to create multiple text values on Bar Char...
- Subscribe to RSS Feed
- Mark Topic as New
- Mark Topic as Read
- Float this Topic for Current User
- Bookmark
- Subscribe
- Mute
- Printer Friendly Page
- Mark as New
- Bookmark
- Subscribe
- Mute
- Subscribe to RSS Feed
- Permalink
- Report Inappropriate Content
How to create multiple text values on Bar Chart
I keep getting asked this question and have been unable to find an acceptable working solution.
We have a bar chart that has two dimensions (entity and rating). We have one expression for the count. The bar charts are stacked. I've attached a picture for reference.
The question we keep getting asked is can we have the percentage relative to one of the ratings along with the total number. In other words, if entity "ABC" has 100 Pass ratings and 5 Marginal Rating and 10 Fail Ratings, the user would like to see the total count and the percentage of fails next to each bar on the chart. So the display for this entity would show for example "115 / 8.70%".
Obviously, we can create tables of numbers that show this information, but the users want the visual appeal of the chart with the number right there and not have to look around or try to associate line 1 with line 1 from a text grid, etc...
- Mark as New
- Bookmark
- Subscribe
- Mute
- Subscribe to RSS Feed
- Permalink
- Report Inappropriate Content
Interestingly enough they don't technically override it. If you go to the Presentation tab there is an option in the middle of the screen called "Plot Values Inside Segments". If you select that option the individual bars get their numbers if there is room to display them. So to me it appears the numbers are there, just need a way to get at them and display them in a custom format.
============================================
The problem is that you can't calculate it through every value of the 'stack'. Sometimes it takes one value from top and some times another from bottom. So unfortunately you can't calculate the ratio and the value of each part as you want.
I think this is another reason why QV overrides text representation of expression by default and displays only total amount for a stack bar.
- Mark as New
- Bookmark
- Subscribe
- Mute
- Subscribe to RSS Feed
- Permalink
- Report Inappropriate Content
It seems to work... (I have 2 dims: d1 and d2, and Plot Values inside segments checked)
=dual(Sum(v) & ' (' & num(Sum(v)/Sum(total<d1> v), '0%') & ')', Sum (v))
- Mark as New
- Bookmark
- Subscribe
- Mute
- Subscribe to RSS Feed
- Permalink
- Report Inappropriate Content
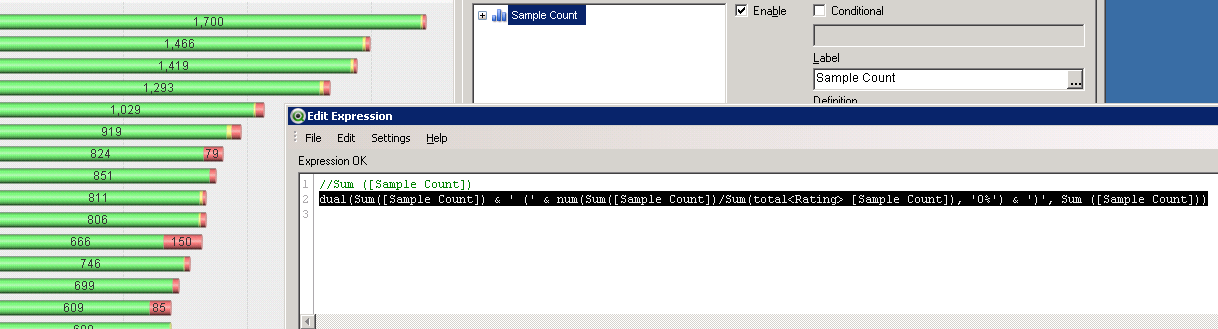
Tried that and it did not work. Here is the expression I used:
dual(Sum([Sample Count]) & ' (' & num(Sum([Sample Count])/Sum(total<Rating> [Sample Count]), '0%') & ')', Sum ([Sample Count]))
And a screen shot
- Mark as New
- Bookmark
- Subscribe
- Mute
- Subscribe to RSS Feed
- Permalink
- Report Inappropriate Content
And for information my dimension 1 is a cyclic group, dimension 2 is Rating.
- Mark as New
- Bookmark
- Subscribe
- Mute
- Subscribe to RSS Feed
- Permalink
- Report Inappropriate Content
Change the number format of expression to Mixed.
That may be a problem:
Sum(total<Rating> [Sample Count])
Shouldn't you calculate total for the first dimension (I thought you want to calculate the ratio of each part of row/stack) ?
If so, I don't know whether total<CyclicGroupLable> works.
If it doesn't work you can simply write separate expressions for each field in cyclic group and then use GetCurrentField(groupname) function with if statement to choose the right one.
- Mark as New
- Bookmark
- Subscribe
- Mute
- Subscribe to RSS Feed
- Permalink
- Report Inappropriate Content
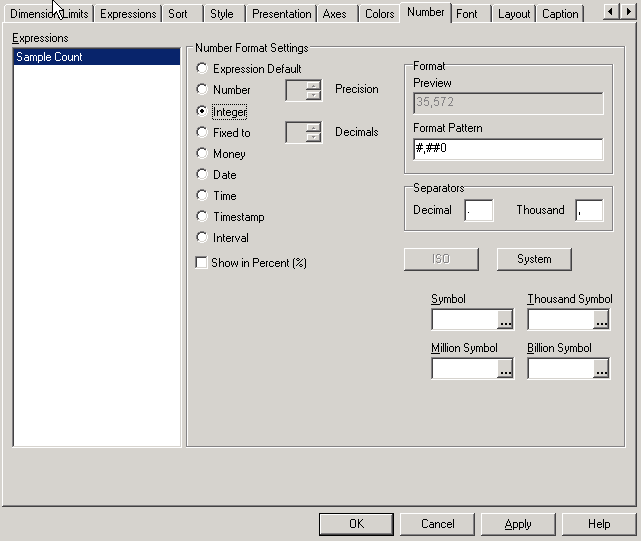
I do not see an option for mixed, or I'm not sure where that option exists. See screen shot attached
Additionally, they want to see the total count for the line and the percentage for one specific rating which in this case happens to be the ones with Fail.
Additionally, when the numbers are displayed on the individual segments, the system will not display numbers where the segments are to small. So having the percentage displayed on each is a good idea, but the system is not going to display that when the percentage is say 1% because it can not fit.
Screenshot:
- Mark as New
- Bookmark
- Subscribe
- Mute
- Subscribe to RSS Feed
- Permalink
- Report Inappropriate Content
Choose Expression Default.
Otherwise QV replaces text representation of dual() function with selected format.
- Mark as New
- Bookmark
- Subscribe
- Mute
- Subscribe to RSS Feed
- Permalink
- Report Inappropriate Content
So having the percentage displayed on each is a good idea, but the system is not going to display that when the percentage is say 1% because it can not fit.
In this case, is it important compared to other segments ?
I guess, to analyse such small deviations user should select something, otherwise it doesn't make sense.
- Mark as New
- Bookmark
- Subscribe
- Mute
- Subscribe to RSS Feed
- Permalink
- Report Inappropriate Content
A bit like receccad suggested, I do aging bar charts with percentages appearing at the bottom and values along the top of the bars, using two expressions, one relative and one absolute. By setting the two expressiong to have different axis, the bar distance to 0 and the bar clustering to 8 it just about passes (see attached).
Can override the grey text by changing the Text Colour behind expression that is on the axis.
Jonathan
- Mark as New
- Bookmark
- Subscribe
- Mute
- Subscribe to RSS Feed
- Permalink
- Report Inappropriate Content
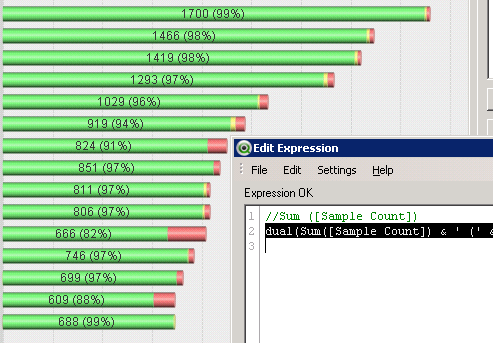
Moderate progress made. Obviously, this does not work for my scenario where they want to see to total for the entire line and the percentage for the fail rating, but I am posting this so others who may be looking/browsing see that they can do this one option.
Expression is:
dual(Sum([Sample Count]) & ' (' & num(Sum([Sample Count])/Sum(total<[Supplier Group 1]> [Sample Count]), '0%') & ')', Sum ([Sample Count]
))
Dimension 1 is a cyclic group called "Supplier Group 1"
And here is the result. Good to know we can at least do this. Options needed to make work are on the Expressions tab "Values on Data Points", on the Presentation tab "Plot Values Inside Segments" and on the Number tab "Expression Default"
Good to know we can do this. Thanks for the assistance and insight even though it doesn't meet my specific requirements. If they would just allow this to dual function to work for the entire line where values are displayed at end on line and not the segments, I could make it work. So close.