Unlock a world of possibilities! Login now and discover the exclusive benefits awaiting you.
- Qlik Community
- :
- All Forums
- :
- QlikView App Dev
- :
- Re: How to create multiple text values on Bar Char...
- Subscribe to RSS Feed
- Mark Topic as New
- Mark Topic as Read
- Float this Topic for Current User
- Bookmark
- Subscribe
- Mute
- Printer Friendly Page
- Mark as New
- Bookmark
- Subscribe
- Mute
- Subscribe to RSS Feed
- Permalink
- Report Inappropriate Content
How to create multiple text values on Bar Chart
I keep getting asked this question and have been unable to find an acceptable working solution.
We have a bar chart that has two dimensions (entity and rating). We have one expression for the count. The bar charts are stacked. I've attached a picture for reference.
The question we keep getting asked is can we have the percentage relative to one of the ratings along with the total number. In other words, if entity "ABC" has 100 Pass ratings and 5 Marginal Rating and 10 Fail Ratings, the user would like to see the total count and the percentage of fails next to each bar on the chart. So the display for this entity would show for example "115 / 8.70%".
Obviously, we can create tables of numbers that show this information, but the users want the visual appeal of the chart with the number right there and not have to look around or try to associate line 1 with line 1 from a text grid, etc...
- Mark as New
- Bookmark
- Subscribe
- Mute
- Subscribe to RSS Feed
- Permalink
- Report Inappropriate Content
your still losing the point, you think the long list is the problem it is not
If a user make a selection that results in 3 entities and 3 stackable bars. The first entity could have 10,000 documents, the second could have 200 documents and the third just 5 documents.
The third entities numbers would not display and this would not be due to scrolling as there would only be 3 rows.
The text already displays outside the bars if we turn off the segments - the system functions that way already. It does just not let us use the dual function for that text, but it allows it for the text inside which may not display if the bar does not have room to display. This is a problem for the users
- Mark as New
- Bookmark
- Subscribe
- Mute
- Subscribe to RSS Feed
- Permalink
- Report Inappropriate Content
The first entity could have 10,000 documents, the second could have 200 documents and the third just 5 documents.
And the user see that the third is too small to take it into account with the others. And if he wants to examine that small entitie he can just select it.
Anyway, its up to you what to choose in your project.
- Mark as New
- Bookmark
- Subscribe
- Mute
- Subscribe to RSS Feed
- Permalink
- Report Inappropriate Content
Maybe like this?
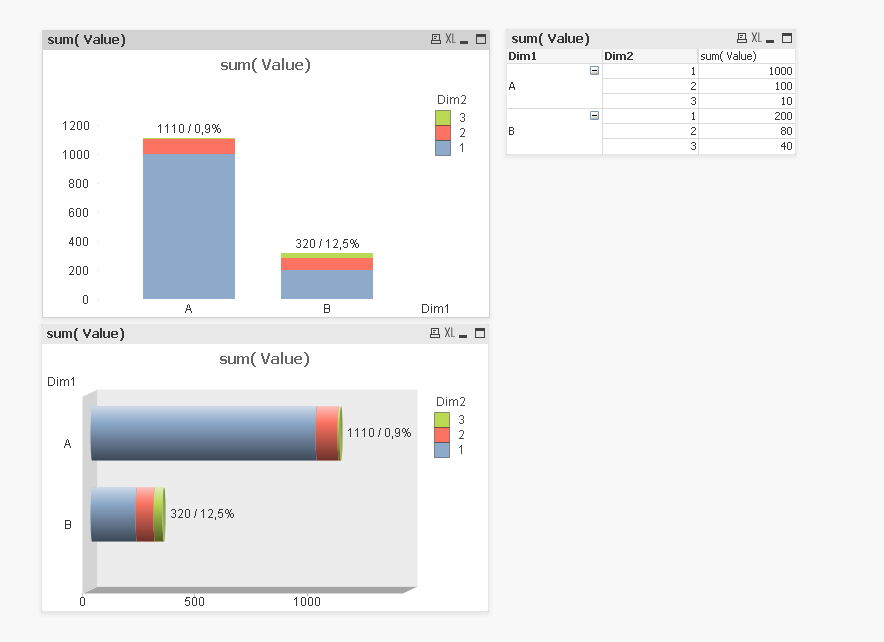
Try a second expression with something like
=sum(total<Dim1> Value) & ' / '& num(sum({<Dim2={3}>} Value) / sum(total<Dim1> Value),'#,0%')
Disable 'bar' display option for that expression and enable 'values on data points' instead.
See attached sample.
Have fun,
Stefan
- Mark as New
- Bookmark
- Subscribe
- Mute
- Subscribe to RSS Feed
- Permalink
- Report Inappropriate Content
We've tried something like this already, but not so complex.
It seems it's calculated once for each Dim1... so it was dropped.
But I played with your sample and I think he can even use this:
=sum(total<Dim1> Value) & ' ('& concat(total<Dim1> aggr(num(sum(Value) / sum(total<Dim1> Value),'#,0%'), Dim1, Dim2), ' | ') & ')'
But the sort is reversed.
- Mark as New
- Bookmark
- Subscribe
- Mute
- Subscribe to RSS Feed
- Permalink
- Report Inappropriate Content
As I've understood the OP's requirement:
Additionally, they want to see the total count for the line and the percentage for one specific rating which in this case happens to be the ones with Fail.
he wants to see just two numbers per dim1, one total, one percentage. He wants to see it next to the bar.
I think this is what my sample demonstrates.
I haven't noticed that you tried this before in above suggested solutions, though I may missed something (the discussion went off in discussing options text on axis and values inside segments together with dual function).
My point is:
If you want to use custom values in a chart, consider using a second expression with only display option 'values on data points'. That's not the one and only solution, but a usual solution for that kind of problems.
If you or the OP want to display all percentages for a bar in a concatenated string like you've suggested, but sorted correctly, just add a sort weight to concat() function as third argument:
=sum(total<Dim1> Value) & ' ('& concat(total<Dim1> aggr(num(sum(Value) / sum(total<Dim1> Value),'#,0%'), Dim1, Dim2), ' | ',Dim2) & ')'
But this creates a quite long text next to each bar, maybe it's better to use some other visualization for that infomation (e.g. using an expression group to switch between an expression showing absolute and relative values)
Regards,
Stefan
- Mark as New
- Bookmark
- Subscribe
- Mute
- Subscribe to RSS Feed
- Permalink
- Report Inappropriate Content
he wants to see just two numbers per dim1, one total, one percentage.
I thought, he extended the question as he then used sum's without set analysis.
In case of using concat() sorting works as Dim2 has numeric values and they sorted in the same order as bar parts are displayed. In general case it doesn't work. With expression sum(Value) as a sort wigth it also doesn't work. So concat() is not useful when the sorting is important.
- Mark as New
- Bookmark
- Subscribe
- Mute
- Subscribe to RSS Feed
- Permalink
- Report Inappropriate Content
Right, sort weight should return a numeric value.
Though this is going a bit off topic, I think you could use concat function also with textual dimension values and different sort orders. For example, if you use a sort by expression (=sum(Value) ) sort order in sort tab for second dimension (which values might be text values), you could try using
aggr(-sum(total<Dim2> Value),Dim1,Dim2)
as sort weight in your concat function.
Or if you want a static sort order, define the sort order together with your dimension values in the script.
- Mark as New
- Bookmark
- Subscribe
- Mute
- Subscribe to RSS Feed
- Permalink
- Report Inappropriate Content
Agree (about off topic).
Anyway, thanks a lot for sorting. Didn't know that aggr() could be used like that.
- Mark as New
- Bookmark
- Subscribe
- Mute
- Subscribe to RSS Feed
- Permalink
- Report Inappropriate Content
Thank you gentleman for your help. swuehl has it correct in his first solution. We want to display the total count and the percentage of one of the ratings to that count.
- Mark as New
- Bookmark
- Subscribe
- Mute
- Subscribe to RSS Feed
- Permalink
- Report Inappropriate Content
Hi stefan WUhl,
I need to add text near the value labels.Is it possible?.If so kindly help me
Thanks & Regards,