Unlock a world of possibilities! Login now and discover the exclusive benefits awaiting you.
- Qlik Community
- :
- All Forums
- :
- QlikView App Dev
- :
- Display Avg Value in Total
- Subscribe to RSS Feed
- Mark Topic as New
- Mark Topic as Read
- Float this Topic for Current User
- Bookmark
- Subscribe
- Mute
- Printer Friendly Page
- Mark as New
- Bookmark
- Subscribe
- Mute
- Subscribe to RSS Feed
- Permalink
- Report Inappropriate Content
Display Avg Value in Total
Hi Everyone,
I have to show Each Items Avg Value in the pivot table liked shown below.
| ItemNo | Quantity | Rate | Tax | ActualValue | Total Cost |
|---|---|---|---|---|---|
| I001 | 10 | 90 | 10 | 100 | 1000 |
| I001 | 15 | 135 | 15 | 150 | 2250 |
| I001 | 10 | 90 | 10 | 100 | 1000 |
| I001 | 15 | 135 | 15 | 150 | 2250 |
| Total | 50 | 450 | 50 | 500 | (6500/50) = 130 |
How to show this?
Thanks
Accepted Solutions
- Mark as New
- Bookmark
- Subscribe
- Mute
- Subscribe to RSS Feed
- Permalink
- Report Inappropriate Content
Hi.
You can use dimensionality() function to override a calculation of Total Cost for Total row:
=if(dimensionality()=0, Sum(Sum(aggr(ActualValue*Quantity, ItemNo)))/Sum(Quantity), Sum(ActualValue*Quantity))
- Mark as New
- Bookmark
- Subscribe
- Mute
- Subscribe to RSS Feed
- Permalink
- Report Inappropriate Content
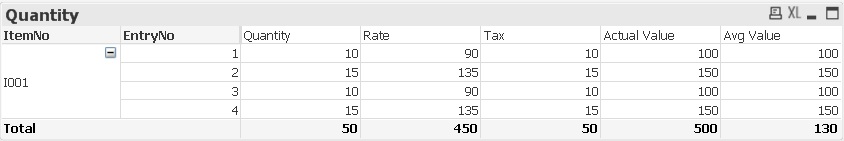
In the example I used the expression:
Actual Value: Sum(Rate + Tax)
Avg Value: Sum((Rate+Tax)*Quantity)/Sum(Quantity)

Attached file for ur reference.
- Mark as New
- Bookmark
- Subscribe
- Mute
- Subscribe to RSS Feed
- Permalink
- Report Inappropriate Content
Hi.
You can use dimensionality() function to override a calculation of Total Cost for Total row:
=if(dimensionality()=0, Sum(Sum(aggr(ActualValue*Quantity, ItemNo)))/Sum(Quantity), Sum(ActualValue*Quantity))
- Mark as New
- Bookmark
- Subscribe
- Mute
- Subscribe to RSS Feed
- Permalink
- Report Inappropriate Content
Hi The Hulk,
What if I have to show all the rows for ItemNo=I001.
Is this expression works ?
e.g. each row contains different EntryNo.
Thanks.
- Mark as New
- Bookmark
- Subscribe
- Mute
- Subscribe to RSS Feed
- Permalink
- Report Inappropriate Content
Sure, in this case you have to intorduce the new dimension.
- Mark as New
- Bookmark
- Subscribe
- Mute
- Subscribe to RSS Feed
- Permalink
- Report Inappropriate Content
Hi The Hulk,
Thanks for reply.Even I tried.Its working correctly.
Thanks once again,
- Mark as New
- Bookmark
- Subscribe
- Mute
- Subscribe to RSS Feed
- Permalink
- Report Inappropriate Content
Hi Whilteline,
Thanks for your reply..I marked your answered as correct because..Use of Dimensionality() is important to show two different calcalation in one column.
Thanks once again.
- Mark as New
- Bookmark
- Subscribe
- Mute
- Subscribe to RSS Feed
- Permalink
- Report Inappropriate Content
I understand 
You're welcome.