Unlock a world of possibilities! Login now and discover the exclusive benefits awaiting you.
- Qlik Community
- :
- All Forums
- :
- QlikView App Dev
- :
- Re: Stacked bar chart don't use all data
- Subscribe to RSS Feed
- Mark Topic as New
- Mark Topic as Read
- Float this Topic for Current User
- Bookmark
- Subscribe
- Mute
- Printer Friendly Page
- Mark as New
- Bookmark
- Subscribe
- Mute
- Subscribe to RSS Feed
- Permalink
- Report Inappropriate Content
Stacked bar chart don't use all data
Hi,
I have a strange issue with stacked bar chart. I have stock values from each month like this
Item Age Month Stock Value Lasteve
A A.<30 201206 Stock1 10 1.6.2012
B A.<30 201206 Stock1 12 3.6.2012
C B.30-180 201206 Stock1 3 6.3.2012
D C.NoEvents 201206 Stock1 5,6
G A.<30 201207 Stock1 5 1.7.2012
C B.30-180 201207 Stock1 3 6.3.2012
D C.NoEvents 201207 Stock1 5,6
A A.<30 201208 Stock1 44 1.8.2012
B A.<30 201208 Stock1 54 3.8.2012
C B.30-180 201208 Stock1 3 6.3.2012
D C.NoEvents 201208 Stock1 5,6
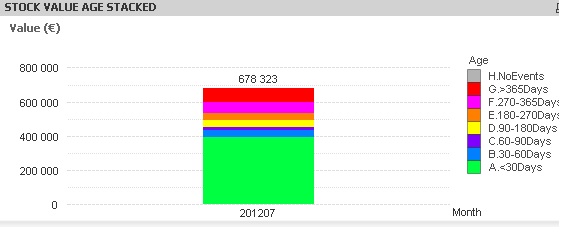
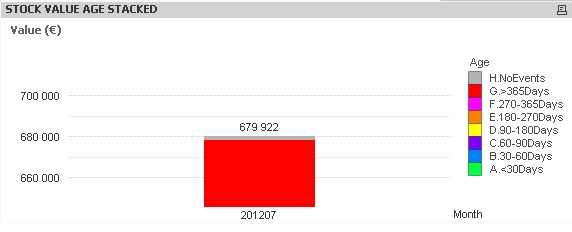
I'm trying to display stacked bar chart dimensions Month and then Age with expression Sum(Value). For some reason it won't show the last age groups sum value and not in total either but if I remove Force 0 from Axes settings then it will show it ok but the layout isn't ok because it won't show the whole bar. You can see the problem below.
Please can you help me to achive what I want.
OK layout, wrong summary (missing the H. Noevents age)
OK Summary value, wrong layout
- Tags:
- new_to_qlikview
Accepted Solutions
- Mark as New
- Bookmark
- Subscribe
- Mute
- Subscribe to RSS Feed
- Permalink
- Report Inappropriate Content
Hey,
I had the same problem today and it took me up to 3 hours to get the solution, or let's call it a workaround:
It helped for me to sort the Legend in another way. Try not to sort from "A->Z" but from "Z->A", afterwards I got the right sums...
By the way: This is Version 11!!!! How the f**** can something like that happen?
Regards Klaus
- Mark as New
- Bookmark
- Subscribe
- Mute
- Subscribe to RSS Feed
- Permalink
- Report Inappropriate Content
The solution was exaclty that!!
I just changed the sort order and volá!
Thanks a million!