Unlock a world of possibilities! Login now and discover the exclusive benefits awaiting you.
- Qlik Community
- :
- All Forums
- :
- QlikView App Dev
- :
- Re: Two structures in the same excel file
- Subscribe to RSS Feed
- Mark Topic as New
- Mark Topic as Read
- Float this Topic for Current User
- Bookmark
- Subscribe
- Mute
- Printer Friendly Page
- Mark as New
- Bookmark
- Subscribe
- Mute
- Subscribe to RSS Feed
- Permalink
- Report Inappropriate Content
Two structures in the same excel file
Hi everybody, I have many excel files in a folder, the problem is that in this files, I have two different structures, I would like to load data from this files:
Example:
| City A | City B | City C | City D | |||
| Produit | Centre | Stock | 22 | 28 | 34 | 40 |
| a | ZIKX | Jr1 | 3 | 3 | 3 | 3 |
| a | ZIKX | Jr2 | 4 | 4 | 4 | 4 |
| a | ZIKX | Jr3 | 5 | 5 | 5 | 5 |
| a | ZIKX | Jr4 | 6 | 6 | 6 | 6 |
| a | ZIKX | Jr5 | 7 | 7 | 7 | 7 |
| a | ZIKX | Jr6 | 8 | 8 | 8 | 8 |
| a | ZIKX | Jr7 | 9 | 9 | 9 | 9 |
| a | ZIKX | Jr8 | 10 | 10 | 10 | 10 |
| a | ZIKX | Jr9 | 11 | 11 | 11 | 11 |
| a | ZIKX | Jr10 | 12 | 12 | 12 | 12 |
| a | ZIKX | Jr11 | 13 | 13 | 13 | 13 |
| a | ZIKX | Jr12 | 14 | 14 | 14 | 14 |
| a | ZIKX | Jr13 | 15 | 15 | 15 | 15 |
| b | ZIKX | Stock | 16 | 16 | 16 | 16 |
| b | ZIKX | Jr1 | 16 | 16 | 16 | 16 |
| b | ZIKX | Jr2 | 17 | 17 | 17 | 17 |
| b | ZIKX | Jr3 | 18 | 18 | 18 | 18 |
| b | ZIKX | Jr4 | 19 | 19 | 19 | 19 |
| b | ZIKX | Jr5 | 20 | 20 | 20 | 20 |
| b | ZIKX | Jr6 | 21 | 21 | 21 | 21 |
| b | ZIKX | Jr7 | 22 | 22 | 22 | 22 |
| b | ZIKX | Jr8 | 23 | 23 | 23 | 23 |
| b | ZIKX | Jr9 | 24 | 24 | 24 | 24 |
| b | ZIKX | Jr10 | 25 | 25 | 25 | 25 |
| b | ZIKX | Jr11 | 26 | 26 | 26 | 26 |
| b | ZIKX | Jr12 | 27 | 27 | 27 | 27 |
| b | ZIKX | Jr13 | 28 | 28 | 28 | 28 |
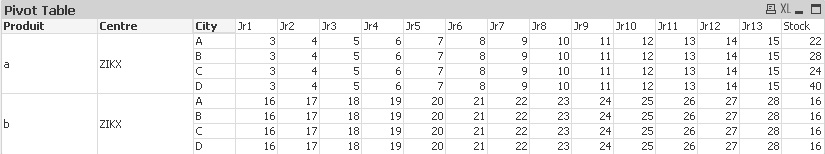
The result that I would like to have is:
| Produit | Centre | City | Stock | Jr1 | Jr2 | Jr3 | Jr4 | Jr5 | Jr6 | Jr7 | Jr8 | Jr9 | Jr10 | Jr11 | Jr12 | Jr13 |
| a | ZIKX | A | 22 | 3 | 4 | 5 | 6 | 7 | 8 | 9 | 10 | 11 | 12 | 13 | 14 | 15 |
| a | ZIKX | B | 28 | 3 | 4 | 5 | 6 | 7 | 8 | 9 | 10 | 11 | 12 | 13 | 14 | 15 |
| a | ZIKX | C | 34 | 3 | 4 | 5 | 6 | 7 | 8 | 9 | 10 | 11 | 12 | 13 | 14 | 15 |
| a | ZIKX | D | 40 | 3 | 4 | 5 | 6 | 7 | 8 | 9 | 10 | 11 | 12 | 13 | 14 | 15 |
| b | ZIKX | A | 16 | 16 | 17 | 18 | 19 | 20 | 21 | 22 | 23 | 24 | 25 | 26 | 27 | 28 |
| b | ZIKX | B | 16 | 16 | 17 | 18 | 19 | 20 | 21 | 22 | 23 | 24 | 25 | 26 | 27 | 28 |
| b | ZIKX | C | 16 | 16 | 17 | 18 | 19 | 20 | 21 | 22 | 23 | 24 | 25 | 26 | 27 | 28 |
| b | ZIKX | D | 16 | 16 | 17 | 18 | 19 | 20 | 21 | 22 | 23 | 24 | 25 | 26 | 27 | 28 |
Thank you.
Zak
- Tags:
- qlikview_scripting
Accepted Solutions
- Mark as New
- Bookmark
- Subscribe
- Mute
- Subscribe to RSS Feed
- Permalink
- Report Inappropriate Content
Hi, zykooo88.
Use crosstable(Value, City, 3) statment (look at help). It allows you to load your data like a straight table with City as another field.
Then you can easily create a Chart with Produit, Centre, City, Stock as dimensons and Sum(value) as expression.
- Mark as New
- Bookmark
- Subscribe
- Mute
- Subscribe to RSS Feed
- Permalink
- Report Inappropriate Content
If your question is achive the 2nd table format in Qlikview then here is one of the solution.
Have Dimensions as: Produit, Centre, Stock
Have 4 Expressions for each City: Sum([City A]), Sum([City B]), Sum([City C]), Sum([City D])
You can achive this by Pivot Table.
If your questions is more about loading then scirpt in different way, then it has to be handled at the LOAD Script level. Using TRANPORSE option.
- Mark as New
- Bookmark
- Subscribe
- Mute
- Subscribe to RSS Feed
- Permalink
- Report Inappropriate Content
Hi, zykooo88.
Use crosstable(Value, City, 3) statment (look at help). It allows you to load your data like a straight table with City as another field.
Then you can easily create a Chart with Produit, Centre, City, Stock as dimensons and Sum(value) as expression.