Unlock a world of possibilities! Login now and discover the exclusive benefits awaiting you.
- Qlik Community
- :
- All Forums
- :
- QlikView App Dev
- :
- Re: creating dimension from column value and findi...
- Subscribe to RSS Feed
- Mark Topic as New
- Mark Topic as Read
- Float this Topic for Current User
- Bookmark
- Subscribe
- Mute
- Printer Friendly Page
- Mark as New
- Bookmark
- Subscribe
- Mute
- Subscribe to RSS Feed
- Permalink
- Report Inappropriate Content
creating dimension from column value and finding sum of columns
Hi ,
I am looking for a solution to the below described solution...
I have a query which returns the following result
But, in qlikview, i want to model it slightly differently in a chart..
i.e. i want to pull out each individual value from 'batch_month' field and make it a dimension...and enter the corresponding fpr_brl_amount under it.
Also, at the end, I want to create a new colum 'Accumulated' that will sum all the values in the row.
I tried something, but it was giving me 'accumulated' field after each month..
I have attached a file detailing the query and the chart details.
Can anyone help me out with this, please?
Regards,
Anju
Accepted Solutions
- Mark as New
- Bookmark
- Subscribe
- Mute
- Subscribe to RSS Feed
- Permalink
- Report Inappropriate Content
Hi,
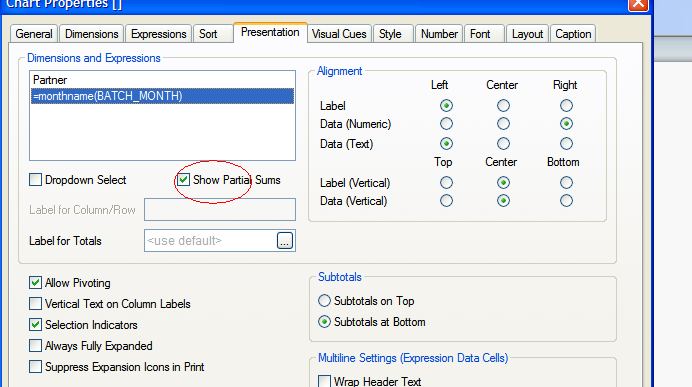
You can use pivot table then at the presentation tab, check show partial sums for BATCH_MONTH field.
Regards,
Janzen
- Mark as New
- Bookmark
- Subscribe
- Mute
- Subscribe to RSS Feed
- Permalink
- Report Inappropriate Content
Hi,
You can use pivot table then at the presentation tab, check show partial sums for BATCH_MONTH field.
Regards,
Janzen
- Mark as New
- Bookmark
- Subscribe
- Mute
- Subscribe to RSS Feed
- Permalink
- Report Inappropriate Content
Hi Janzen,
Thanks a lot for taking the time to reply!
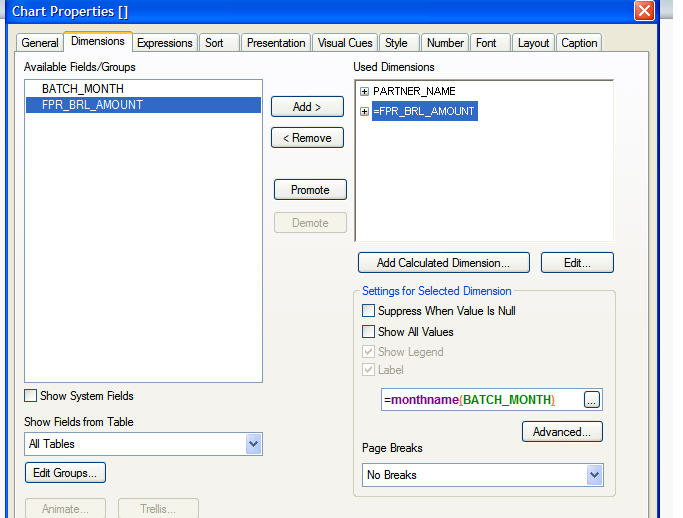
I added a pivot table, then under Dimensions tab, i added partner name as one field,
and the second field--- i gave value as FPR_BRL_AMOUNT with label as monthname(BATCH_MONTH)..
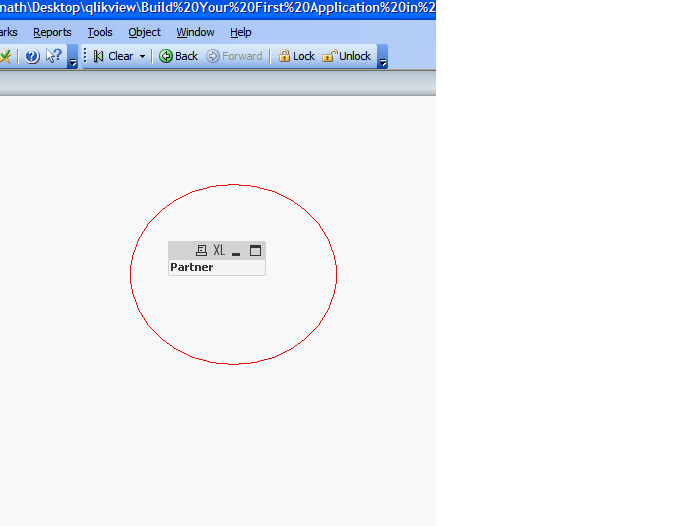
and like you said under presentation tab, I checked partial sum for BATCH_MONTH...but, the chart is not getting populated..
Kindly help me out..
Regards,
Anju
- Mark as New
- Bookmark
- Subscribe
- Mute
- Subscribe to RSS Feed
- Permalink
- Report Inappropriate Content
 I
I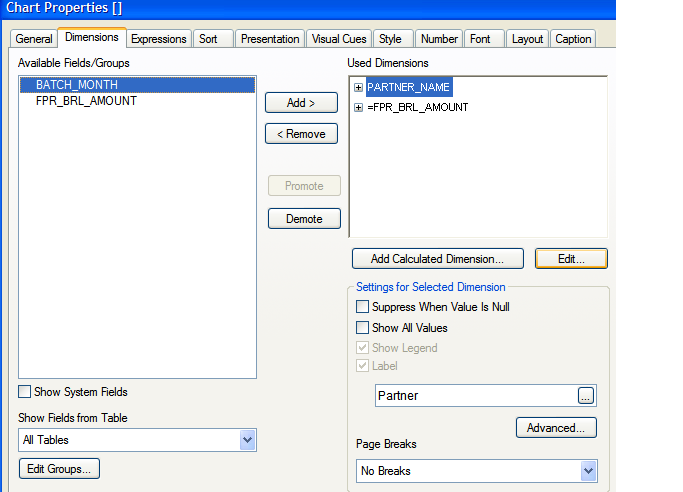
 I am attaching 4 images to show what I have done..
- Mark as New
- Bookmark
- Subscribe
- Mute
- Subscribe to RSS Feed
- Permalink
- Report Inappropriate Content
Thanks a lot, Janzen..It worked ...I did a little repositioning of the columns too..
Regards,
Anju