Unlock a world of possibilities! Login now and discover the exclusive benefits awaiting you.
- Qlik Community
- :
- All Forums
- :
- QlikView App Dev
- :
- Bar Chart - Drilling down
- Subscribe to RSS Feed
- Mark Topic as New
- Mark Topic as Read
- Float this Topic for Current User
- Bookmark
- Subscribe
- Mute
- Printer Friendly Page
- Mark as New
- Bookmark
- Subscribe
- Mute
- Subscribe to RSS Feed
- Permalink
- Report Inappropriate Content
Bar Chart - Drilling down
Hi All,
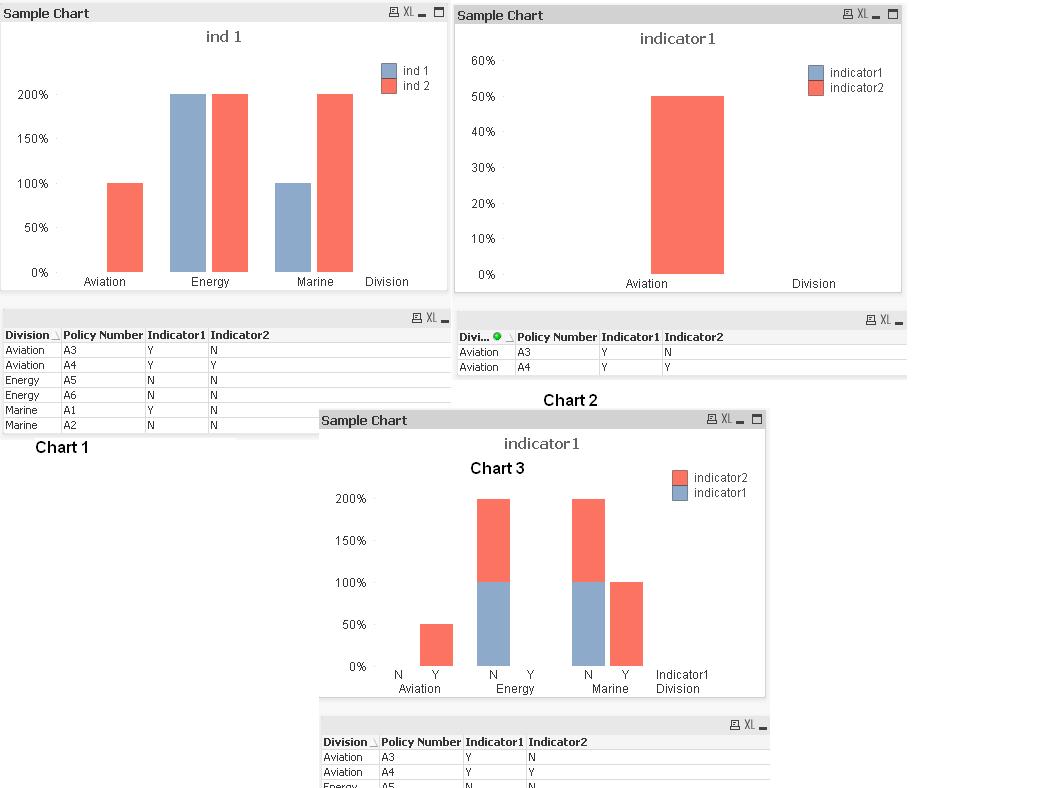
I am using QlikView 10. Below is the data that I am reading from the spreadsheet.
Division | Policy Number | Indicator1 | Indicator1 |
Aviation | A3 | Y | N |
Aviation | A4 | Y | Y |
Energy | A5 | N | N |
Energy | A6 | N | N |
Marine | A1 | Y | N |
Marine | A2 | N | N |
Created a bar chart. The chart has Division as the dimension, two expressions
expression1 : =Count({$<Indicator1={'N'}>} [Policy Number])/Count([Policy Number])
expression2 : =Count({$<Indicator2={'N'}>} [Policy Number])/Count([Policy Number])
The chart shows the bars correctly, For all the divisions where the Indicator's 1 and 2 are N. The % of records that have N are shown.
(Chart1 in attachment)
When i click on the Red bar "Aviation" then I get below result.
(Chart2 in attachment)
However on click I want only the first record in aviation to be shown. i.e. the dataset get filtered for N records only. When i click again the chart comes back to display all the data.
If I add indicator1 and indicator2 also as dimensions then I get a stacked sort of chart, which does not serve my purpose.
(Chart3 in attachment)
However this allows me to narrow down to only the N indicator1 record for a Division which is what exactly I am looking for. I know there are alternate states on QlikView 11. Unfortunately I am on QlikView 10 project and have no option to switch the version. Could someone help?
I am just looking to display the chart I have initially got "Chart1" be able to drill down to division and then to respective N indicators.
thanks,
Rajesh Vaswani