Unlock a world of possibilities! Login now and discover the exclusive benefits awaiting you.
- Qlik Community
- :
- All Forums
- :
- QlikView App Dev
- :
- Re: Pivot with Top 10 customers AND...
- Subscribe to RSS Feed
- Mark Topic as New
- Mark Topic as Read
- Float this Topic for Current User
- Bookmark
- Subscribe
- Mute
- Printer Friendly Page
- Mark as New
- Bookmark
- Subscribe
- Mute
- Subscribe to RSS Feed
- Permalink
- Report Inappropriate Content
Pivot with Top 10 customers AND...
I would like to show the sales revenue of the top ten customers (ranked by revenue). I have solved this.
Also I would like a subtotal of these, and on the next row, the subtotal of all the other customers (number 11 and up).
At bottom I would like a grand total for all customers, (number 1 and all).
So..
Customer 1
Customer 2
.
.
Customer 10
SUBTOTAL TOP 10
ALL OTHER CUSTOMERS
Grand TOTAL
Can anyone please help?
Thanks!
NorTor
Norway
- Tags:
- new_to_qlikview
- « Previous Replies
- Next Replies »
- Mark as New
- Bookmark
- Subscribe
- Mute
- Subscribe to RSS Feed
- Permalink
- Report Inappropriate Content
Dear Tor,
Was not sure of your requirements, therefore i have given you the top five customers irrespective of Cutomer Type. The new Top 5 Customer table in the file attached give you your top 5 customers accross the company and groups all others in 'Other Customers' which are stacked at the bottom.
Hope this is what you were after.
Regards
Rahul
- Mark as New
- Bookmark
- Subscribe
- Mute
- Subscribe to RSS Feed
- Permalink
- Report Inappropriate Content
Dear Lakhina,
Thanks for your response.
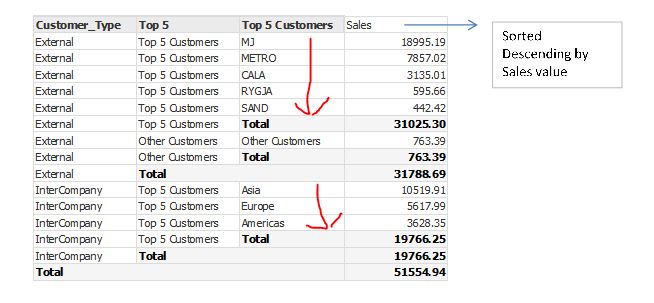
I would like to get the result of Top 5 Customers being Sorted by their Sales Value
Just take the example for Customer Type = InterCompany,
Customer Type Top 5 Top 5 Customers Sales
InterCompany Top 5 Customers Asia 10519.91
Europe 5617.99
AMericas 3628.35
If Customer Type is External, and under Top 5 Customers, then the Top 5 Customers Column should start from the biggest Sales which are
MJ 18995.19
Metro 7857.02
CALA 3135.01
RYGJA 595.66
SAND 442.42
Thank you.
- Mark as New
- Bookmark
- Subscribe
- Mute
- Subscribe to RSS Feed
- Permalink
- Report Inappropriate Content
Dear Lakhina,
Is it possible to achieve the above ?
Thanks.
- Mark as New
- Bookmark
- Subscribe
- Mute
- Subscribe to RSS Feed
- Permalink
- Report Inappropriate Content
Like this!
- Mark as New
- Bookmark
- Subscribe
- Mute
- Subscribe to RSS Feed
- Permalink
- Report Inappropriate Content
Dear Lakhina,
Unfortunately not or maybe I didn't get your point from your qvw file.
Basically, my question is how to sort based on the sum(value) of the calculated dimension.
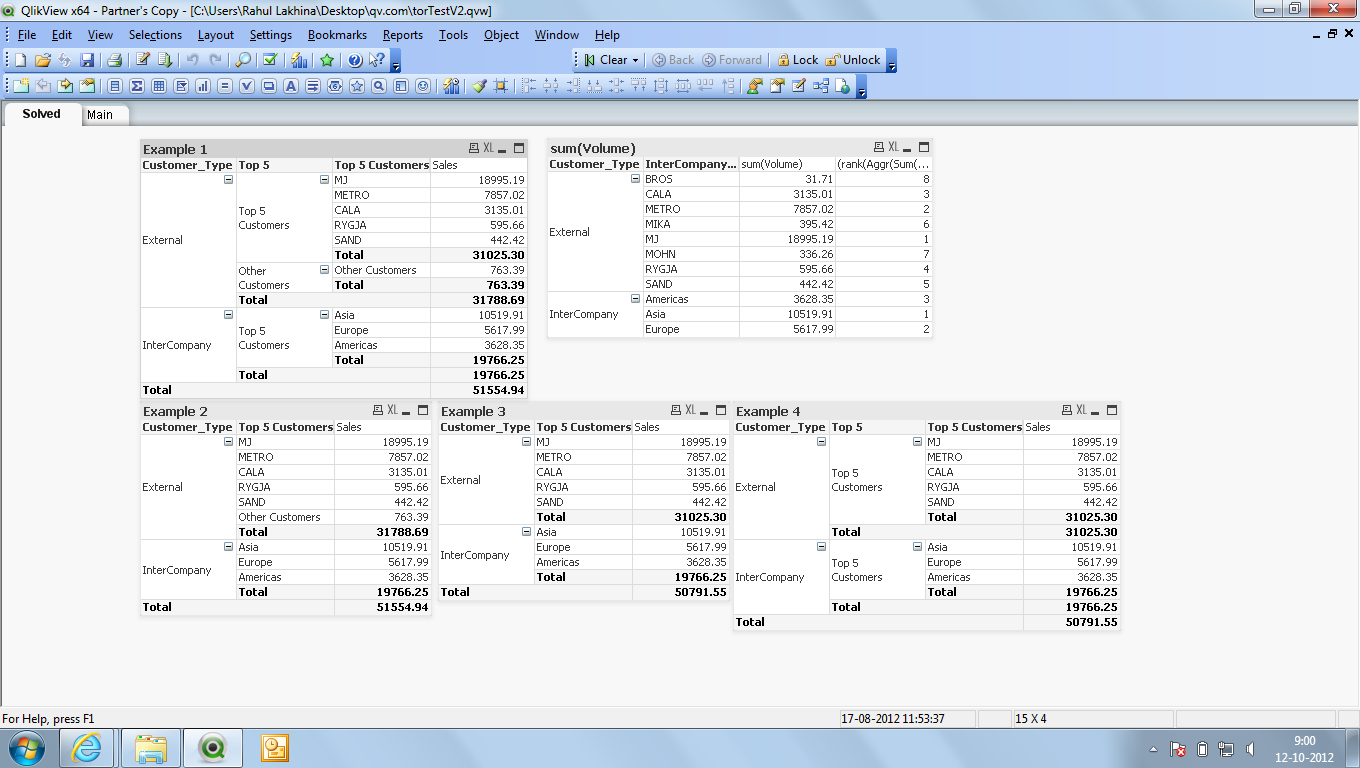
Lets take Example 1 from your qvw
The Top 5 Customers of External, there are 5 which show in the table as
RYGJA - $ 595.66
MJ - $ 18995.19
CALA - $ 3135.01
METRO - $ 7857.02
SAND - $ 442.42
I wish that it can be sorted descending based on Sum(Value) of the calculated dimension Top 5 Customers.
MJ - $ 18995.19
METRO - $ 7857.02
CALA - $ 3135.01
RYGJA - $ 595.66
SAND - $ 442.42
Is it possible ?
- Mark as New
- Bookmark
- Subscribe
- Mute
- Subscribe to RSS Feed
- Permalink
- Report Inappropriate Content
Hi Tor,
I guess this why i have been stumped with your request. As in my copy or the copy that I sent to you the data is already sorted.
This has been achived by using an expression to sort the Top 5 Customers please see QVW for detail.
Regards
Rahul
- Mark as New
- Bookmark
- Subscribe
- Mute
- Subscribe to RSS Feed
- Permalink
- Report Inappropriate Content
Dear Lakhina,
Sorry.. that's my mistake. It seems it didn't run using Qlikview 8.5 client. So I change to Qlikview 10 and yes, it is showing exactly as per your image.
Unfortunately, I still can't get it correct with my qvw. Sorry, I am quite new in Qlikview.
Could you help me with the data that I have ?
This is the source data (data_table_Jor)
And the other is expected_result_Jor which contains 2 worksheet.
Could you help me on that ? I tried to simulate based on your qvw but the result is always wrong, so I believe I have not understood much on the calculate dimension.
- Mark as New
- Bookmark
- Subscribe
- Mute
- Subscribe to RSS Feed
- Permalink
- Report Inappropriate Content
Dear Tor,
It cannot be sorted individually by the month in the same table (as we are using month as a dimension) but it can be sorted by overall results i.e. sum of all months together. The same table should reflect the results of individual month on selection.
Hope the example attached works for you.
Regars
R
- Mark as New
- Bookmark
- Subscribe
- Mute
- Subscribe to RSS Feed
- Permalink
- Report Inappropriate Content
Thanks for your help Lakhina.
Unfortunately, due to the top 10 Charges can be different each month thus, the sorting must be done individual by month. If using your qvw sample, the top 10 Charge will be the same always or the value will not be sorted out correctly in the month.
Is there any other way by adding other dimension to help maybe ?
Thanks.
- Mark as New
- Bookmark
- Subscribe
- Mute
- Subscribe to RSS Feed
- Permalink
- Report Inappropriate Content
Hi,
How are you? Hope you had a great weekend!
The only thing that can be done is creating a variable and letting the user decide what Month they want the table to be sorted on.
Please see example! I do not think anything else would work sorry.
Please mannualy enter Months 7 to 9 in the InputBox called VSortByMonth to see how the tables change.
Sorry could not be of much help 
Regards
R
- « Previous Replies
- Next Replies »