Unlock a world of possibilities! Login now and discover the exclusive benefits awaiting you.
- Qlik Community
- :
- All Forums
- :
- QlikView App Dev
- :
- Re: How to define Chart colours
- Subscribe to RSS Feed
- Mark Topic as New
- Mark Topic as Read
- Float this Topic for Current User
- Bookmark
- Subscribe
- Mute
- Printer Friendly Page
- Mark as New
- Bookmark
- Subscribe
- Mute
- Subscribe to RSS Feed
- Permalink
- Report Inappropriate Content
How to define Chart colours
Dear community,
another rahter basic question for you,
I am trying to analyse the colours of the Bikes i sel in a Pie Chart,
The values in the "colour" field are of course: 'black','pink','white etc....
Now when i have a chart of COURSE i want the chart segments to have exactly that colour and not blue for 'black'
I guess this is really easy but i have no idea how to do this
Thanx for your help
Seb
- « Previous Replies
-
- 1
- 2
- Next Replies »
- Mark as New
- Bookmark
- Subscribe
- Mute
- Subscribe to RSS Feed
- Permalink
- Report Inappropriate Content
scdrawert wrote:
hmm i have inputted the expression based on your recommendation in the expression ("sum(sales)") clicked on the + and entered the following in the "pie popout":
=pick(match(Colour, 'black'), RGB(0,0,0))
But the black is still blue
What am i doing wrong?

This expression assumes that the colour field is named Colour and is the dimension of the pie chart (so that each slice only has one possible colour). Update the expression with the correct field name.
Jonathan
- Mark as New
- Bookmark
- Subscribe
- Mute
- Subscribe to RSS Feed
- Permalink
- Report Inappropriate Content
correct - the color value is stored in the field named "colour" possible value is e.g. "black"
i have now a massive IF(colour='black".... chain in there . its not very elegant but it works for now 😕
- Mark as New
- Bookmark
- Subscribe
- Mute
- Subscribe to RSS Feed
- Permalink
- Report Inappropriate Content
Remember that field names are case sensitive, so field Colour is differenr to field colour. Try the correct one in the pick(match() statement. Much easier to write and maintain than nested ifs!
- Mark as New
- Bookmark
- Subscribe
- Mute
- Subscribe to RSS Feed
- Permalink
- Report Inappropriate Content
I suggest building a table for the colors instead of handling it in expressions. You're surely going to want these colors in multiple places, which means repeating the expression. You could create a variable to hold the expression and use the variable, but I'd build a color table instead. I just think it's cleaner, and would allow you to load colors from an external source like a spreadsheet if desired. It requires script access and a reload to change, of course, which might occasionally be an issue.
The attached example allows you to explicitly assign colors to customers by RGB values, and then automatically builds random colors for any customers you didn't assign. You don't want the random color part in this case, so skip that and make certain that all colors are assigned.
The color expressions in these charts are also more complicated than you'd likely need. All you'd need is rgb(R,G,B) in most cases. These charts were doing more complicated things like highlighting the weekday data.
Edit: Ooops, sorry, I see you're in personal edition. I'll make another edit to tell you all the relevant information.
Edit 2: Actually, rather than describe the example I posted, let me just give you what I think you should do. Consider a spreadsheet instead of an inline load, but here's the idea. In the script:
[Colours]:
LOAD * INLINE [
colour,R,G,B
Red,255,0,0
Pink,255,150,150
Green,0,255,0
etc.
];
Then in the chart, in the background colour expression:
rgb(R,G,B)
- Mark as New
- Bookmark
- Subscribe
- Mute
- Subscribe to RSS Feed
- Permalink
- Report Inappropriate Content
Hi John,
This is great!!.
We have similar scenario where we are applying colors to charts using ColorTable.
We have two tables in QV
Data table with all facts and dimensions
ColorT table with mapping dimension and RGB values
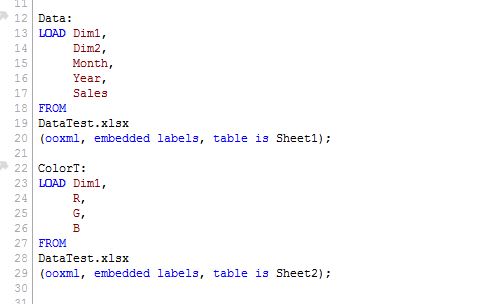
ColorT table doesn't have all the values from my dimension column hence it will apply colors to values which are present in ColorT table.
After applying formula in background color:
=RGB(R,G,B)
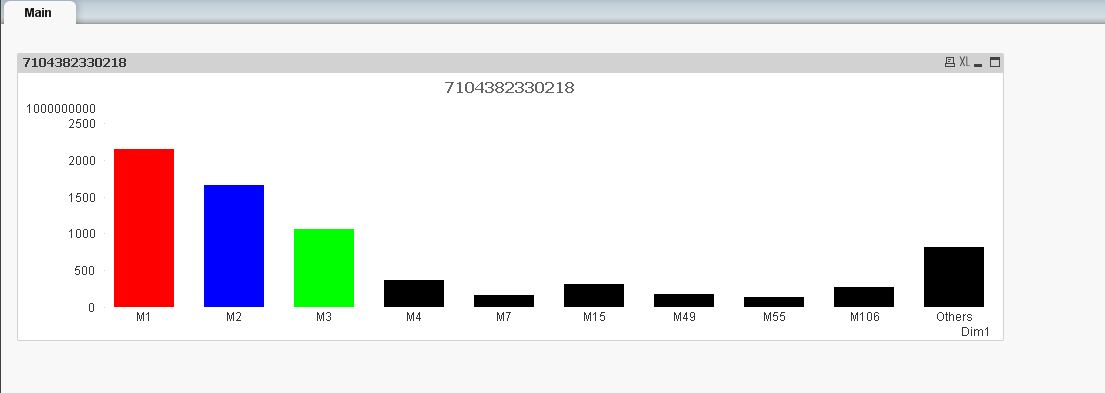
We need to change the color for other values to default colors.
Could you please help us to tackle this?
- Mark as New
- Bookmark
- Subscribe
- Mute
- Subscribe to RSS Feed
- Permalink
- Report Inappropriate Content
Maybe something like if(R+G+B,rgb(R,G,B)). As long as you assign null to the color, it should use the defaults.
However, if you look closely at the example, I gave an arguably more robust solution to the same problem, which was to assign random colors to values that you haven't assigned explicit colors to. That way you're still using the same colors for those values across charts, even when you don't know what the values will be ahead of time to explicitly assign colors to them. On the down side, random colors won't always look very good, but if you reload the example over and over, I think the way I assigned random colors produces pretty good results for customers D & E.
- Mark as New
- Bookmark
- Subscribe
- Mute
- Subscribe to RSS Feed
- Permalink
- Report Inappropriate Content
Thanks John!!
It worked !!!
- « Previous Replies
-
- 1
- 2
- Next Replies »