Unlock a world of possibilities! Login now and discover the exclusive benefits awaiting you.
- Qlik Community
- :
- All Forums
- :
- QlikView App Dev
- :
- Re: Missing values on time dimension
- Subscribe to RSS Feed
- Mark Topic as New
- Mark Topic as Read
- Float this Topic for Current User
- Bookmark
- Subscribe
- Mute
- Printer Friendly Page
- Mark as New
- Bookmark
- Subscribe
- Mute
- Subscribe to RSS Feed
- Permalink
- Report Inappropriate Content
Missing values on time dimension
Hey,
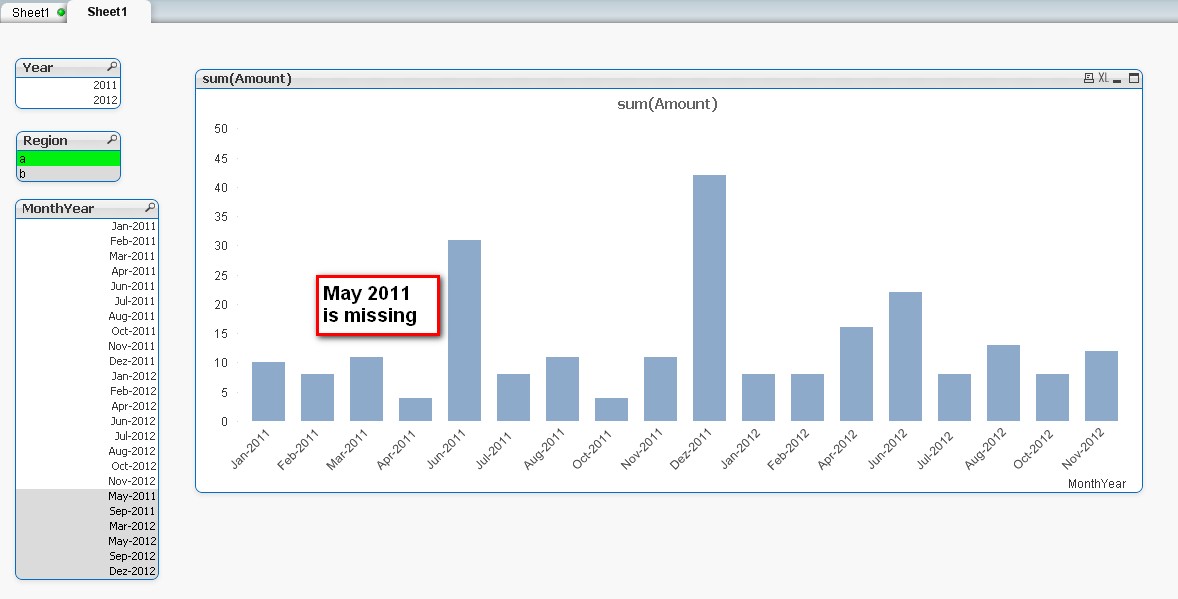
We want to show sales in a bar chart diagram with monthly intervals on the X-axis. Therefore we implemented a master calendar which allows generally to display all months of a year, even when a specific month has no values (having unchecked "Suppress Zero-Values" in the Presentation tab).
Nevertheless, when we select a region which doesn't have values for a certain month, this month isn't shown anymore (e.g. May 2011 for Region "a").
Thank you for your help!
- Mark as New
- Bookmark
- Subscribe
- Mute
- Subscribe to RSS Feed
- Permalink
- Report Inappropriate Content
thank you, but it is returning 4 errors if I add the script to the example above
Table not found
FullRegionsPeriods:
LOAD distinct
Region
Resident FactTable
Table not found
Preiods:
LOAD distinct
MonthYear
Resident FactTable
Table not found
left join(Regions)
LOAD * RESIDENT Preiods
Table not found
DROP TABLES statement
In all honesty, I bumoped into this topic but my environment is a bit different from the OP, I think.
I am just dumping data from a server and, regardlessly from the item selected, I would like to see the month in the graph even if sales were 0 for that particular item.
Sure indeed, the month is present in the table, just not associated with all the item I can select.
I will try to brainstorm a bit about it, thank you for your help so far
- Mark as New
- Bookmark
- Subscribe
- Mute
- Subscribe to RSS Feed
- Permalink
- Report Inappropriate Content
Hey
You can use SetAnalysis to generate dummy entries on X-axis.
If you have a lot of dimensions, using variable is recommented.
Please study the attached document.
- Mark as New
- Bookmark
- Subscribe
- Mute
- Subscribe to RSS Feed
- Permalink
- Report Inappropriate Content
Hello
I'm sharing the same problem so I'm pretty intresting in the solution
The SetAnalysis stuff is great solution but I think that the sample in MasterCalendar is not working.
When selecting region A , May 2011 data disappear from the chart, and if I understood correctly it is what we want to avoid.
Could you please check it out and give us direction?
Thanks a lot for your help
BR
Carlo
- Mark as New
- Bookmark
- Subscribe
- Mute
- Subscribe to RSS Feed
- Permalink
- Report Inappropriate Content
Hello Carlo
True, data disappers because there is no data in the fact table on May.
What would you except to see when you select May 2011?
Best Regards
Pertti
- Mark as New
- Bookmark
- Subscribe
- Mute
- Subscribe to RSS Feed
- Permalink
- Report Inappropriate Content
Hello Pertti
First of all thanks to the reply.
I would need to have ie May 2011 shown with 0 even if there is no value for that month.
I am personaly using a similar graph to see the consumption of a certain component. The data are from a server every month and when there is no consumption for a given component that component is not included in the report
Sinceit is important to get at gllance that the consumption is 0 I would like it well shown in the graph otherwise look like that there is alwayse usage every month.
Actually I was in the understanding that the report you sent was already doing this!
Otherwise I do not understand the need of the SetAnalysis to generate dummy entries on X-axis:
With no selection on Region A, May 11 is well shown (0/empty value) but it is shown even if I cancel the additional variable vMakeTimelineContinuos
Thanks for the time you will dedicate on this
Best regards
Carlo
(I will offer you a lovely cup of coffee if you are coming around Milan )
)
- Mark as New
- Bookmark
- Subscribe
- Mute
- Subscribe to RSS Feed
- Permalink
- Report Inappropriate Content
I'll admit to only skimming the page and not looking at the examples. But attached is one fairly-complicated way to handle it primarily with the data model. Complexity is the only practical drawback I'm aware of, and I've used this approach in one of our real applications, where it has been working just fine. Performance should be high, no new rows in the original table (Edit: requires new rows in the original table), charts don't display missing dates unless you tell them to. I can't take credit - Michael Solomovich gave me the necessary hints to work this out when I was having this same problem.
Practical cases may be simpler than this example. The calendar generation is much more complicated than in my typical applications due to breaking a day into three turns and basing the calendar on my data (where in a typical appliation, I load data based on the desired calendar). I think the things to really look at are the generation of the DateTurnKey in the original table, and the creation of the DateLink table.
It may be confusing why I lock ShowZeroPoints?='N', and then use set analysis to sum({<ShowZeroPoints?={'Y'}>} Sales). It might seem a bit contradictory, and a giant waste of effort. The idea is that most charts don't want anything special. They just want our original data displayed the way QlikView always displays it. Locking the field to N provides exactly that, and means that normal charts don't need to use any set analysis to exclude our extra data. It'll be excluded automatically by the locked field. Only charts that need to show the zero points need to use set analysis, and only to say that they want to show zero points. I have no other charts in the example, so it's a complete waste here, but I think it's an important part of the example if you're trying to apply it to real world cases.
- Mark as New
- Bookmark
- Subscribe
- Mute
- Subscribe to RSS Feed
- Permalink
- Report Inappropriate Content
Hello John
Thanks for the example.
It is quite intresting and it is very good for my training 🙂
Yesterday evening I manage to solve the issue with the suggestion proposed by Whiteline (generating 0 entry) but I will try also your solution
Thanks a lot
Carlo
- Mark as New
- Bookmark
- Subscribe
- Mute
- Subscribe to RSS Feed
- Permalink
- Report Inappropriate Content
Hello
Just to thank you!!!
I have tried your solution and it works fine
Best regards
Carlo
- Mark as New
- Bookmark
- Subscribe
- Mute
- Subscribe to RSS Feed
- Permalink
- Report Inappropriate Content
This set analysis approach is a really good idea. In one scenario, we have a very large but sparsely populated data set with a lot of dimensions. All months would exist across the full data set, but won't be populated for all of the sub groups of dimensions. Bringing in dummy rows with zeros for all combinations doubled the QVW file size and increased the load time dramatically (we are pivoting the data too), so this set analysis approach is very efficient in this scenario for us. Great idea - thanks for sharing it!
Cheers,
Graeme
- Mark as New
- Bookmark
- Subscribe
- Mute
- Subscribe to RSS Feed
- Permalink
- Report Inappropriate Content
Hi John
I have been heavly trying out your example as the "generating 0 entry" has a few side effect that, even if now do not bother me now, they will in future.
I must admit since I'm bit new that the "Turn" stuff complicates my life quite a bit as I have basically two field to take care of : Date (called period in the excel file source data and for unknow reason loaded QV as number - never mind) and a material number KM123 etc
do you have a simpler example you can share? or suggestions?
Feel free to send me to hell if I am asking to much....
Br
Carlo