Unlock a world of possibilities! Login now and discover the exclusive benefits awaiting you.
- Qlik Community
- :
- All Forums
- :
- QlikView App Dev
- :
- Re: Chart visualization Question?
- Subscribe to RSS Feed
- Mark Topic as New
- Mark Topic as Read
- Float this Topic for Current User
- Bookmark
- Subscribe
- Mute
- Printer Friendly Page
- Mark as New
- Bookmark
- Subscribe
- Mute
- Subscribe to RSS Feed
- Permalink
- Report Inappropriate Content
Chart visualization Question?
 Hi,
Hi,
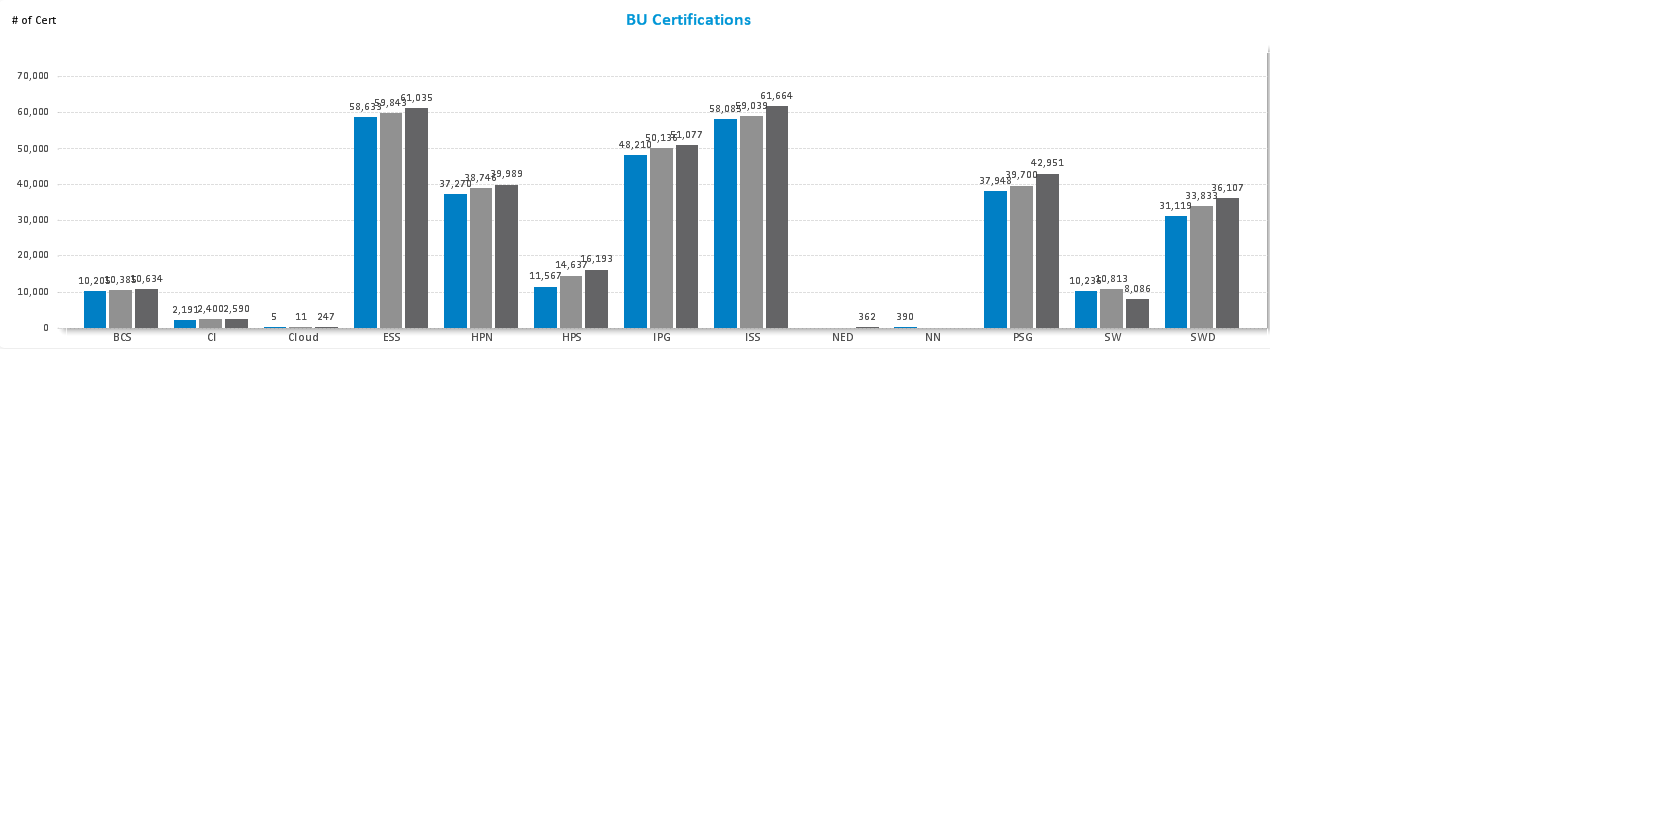
I'm working on a chart and I'm trying to change the direction of the numbers from horizontal to a diagonal view so that they don't look so crowdie. Is there a way of doing that?
Thank you in advance for any help.
Best regards// Ljimenez
- « Previous Replies
-
- 1
- 2
- Next Replies »
Accepted Solutions
- Mark as New
- Bookmark
- Subscribe
- Mute
- Subscribe to RSS Feed
- Permalink
- Report Inappropriate Content
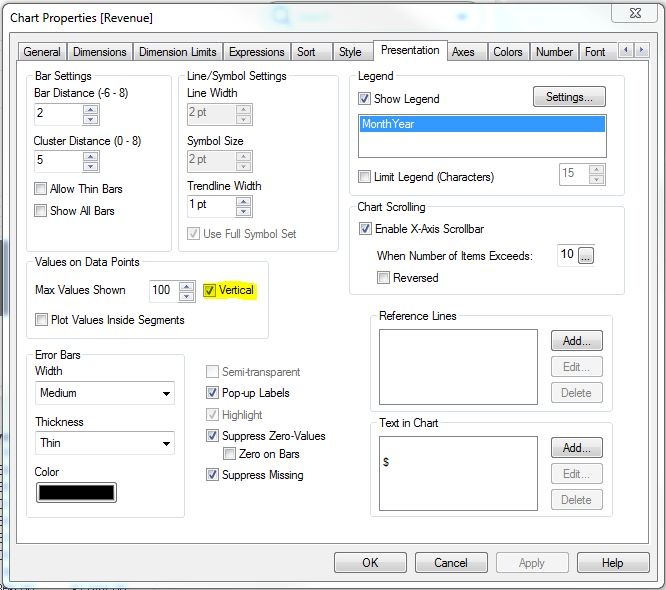
Check the Vertical option of the 'Values on Data Points' box on the Presentation tab of the properties screen
talk is cheap, supply exceeds demand
- Mark as New
- Bookmark
- Subscribe
- Mute
- Subscribe to RSS Feed
- Permalink
- Report Inappropriate Content
Hi
Please check the image.
Hope it helps
Please close the thread by marking correct answer & give likes if you like the post.
- Mark as New
- Bookmark
- Subscribe
- Mute
- Subscribe to RSS Feed
- Permalink
- Report Inappropriate Content
Check the Vertical option of the 'Values on Data Points' box on the Presentation tab of the properties screen
talk is cheap, supply exceeds demand
- Mark as New
- Bookmark
- Subscribe
- Mute
- Subscribe to RSS Feed
- Permalink
- Report Inappropriate Content
If you wanted to keep the numbers outside the data bars, you can make them vertical, but not diagonal to my knowledge.
- Mark as New
- Bookmark
- Subscribe
- Mute
- Subscribe to RSS Feed
- Permalink
- Report Inappropriate Content
Thanks a lot for all the answers, got it to worl 
Same graph, values still look crowdie, changed graph to left to right bars, but how do I add a scroll on the x axis?
Thanks again.
Best regards// Ljimenez
- Mark as New
- Bookmark
- Subscribe
- Mute
- Subscribe to RSS Feed
- Permalink
- Report Inappropriate Content
Thanks a lot for all the answers, got it to worl
Same graph, values still look crowdie, changed graph to left to right bars, but how do I add a scroll on the x axis?
Thanks again.
Best regards// Ljimenez
- Mark as New
- Bookmark
- Subscribe
- Mute
- Subscribe to RSS Feed
- Permalink
- Report Inappropriate Content
Thanks a lot for all the answers, got it to work.
Same graph, values still look crowded, changed graph to left to right bars, but how do I add a scroll on the x axis?
Thanks again.
Best regards// Ljimenez
- Mark as New
- Bookmark
- Subscribe
- Mute
- Subscribe to RSS Feed
- Permalink
- Report Inappropriate Content
HI
Please Check the screenshot..
Check the chekbox..
Edit:
Tick the Enable x-axis scrollbar.
Give number in when number of items exceed: ex:5
Hope it helps
Please close the thread by marking correct answer & give likes if you like the post.
- « Previous Replies
-
- 1
- 2
- Next Replies »