Unlock a world of possibilities! Login now and discover the exclusive benefits awaiting you.
- Qlik Community
- :
- All Forums
- :
- QlikView App Dev
- :
- Custom dimension lines in Pivot chart
Options
- Subscribe to RSS Feed
- Mark Topic as New
- Mark Topic as Read
- Float this Topic for Current User
- Bookmark
- Subscribe
- Mute
- Printer Friendly Page
Turn on suggestions
Auto-suggest helps you quickly narrow down your search results by suggesting possible matches as you type.
Showing results for
Creator III
2012-11-08
09:18 AM
- Mark as New
- Bookmark
- Subscribe
- Mute
- Subscribe to RSS Feed
- Permalink
- Report Inappropriate Content
Custom dimension lines in Pivot chart
Hey,
after spending some time on "trial & error" I finally managed to build the following pivot chart (the last line "Difference %" caused some headache  )
)
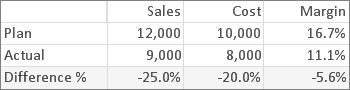
Can anyone tell me, if there is an easier approach than the one I chose... (please have a look at the attached sample qvw).
As I have to extend the chart by adding some more "calculated" lines, the formulas would get rather complex...
Thanks!
Regards, Florian
504 Views
0 Replies