Unlock a world of possibilities! Login now and discover the exclusive benefits awaiting you.
- Qlik Community
- :
- All Forums
- :
- QlikView App Dev
- :
- Re: Drill Down in List showing multiple columns
- Subscribe to RSS Feed
- Mark Topic as New
- Mark Topic as Read
- Float this Topic for Current User
- Bookmark
- Subscribe
- Mute
- Printer Friendly Page
- Mark as New
- Bookmark
- Subscribe
- Mute
- Subscribe to RSS Feed
- Permalink
- Report Inappropriate Content
Drill Down in List showing multiple columns
Hi all,
I am pretty new with QlikView so, please bear with me.
This is my question. I am trying to create a List showing sells by Country for a specific Year. Also, when the client selects a specific country I need to do a drill down that shows the Country, Area and Sales Representative, IN THE SAME LEVEL, instead of showing only area and then Sales Rep.
Is there a way to create a Group dimension where it drill down in to two values at a time (it shows Country, Area and Sales Representative) once the drill down dimension is selected?
Thanks
Julian
- Mark as New
- Bookmark
- Subscribe
- Mute
- Subscribe to RSS Feed
- Permalink
- Report Inappropriate Content
Hi,
Yes it is possible create drill down metrics.
Regards,
Anand
- Mark as New
- Bookmark
- Subscribe
- Mute
- Subscribe to RSS Feed
- Permalink
- Report Inappropriate Content
Can you please show me how?
- Mark as New
- Bookmark
- Subscribe
- Mute
- Subscribe to RSS Feed
- Permalink
- Report Inappropriate Content
Hi,
In a Dimension properties of chart go to edit groups -> create new group with
Country-Area-Sales_Representative and take this group as Drill-dow group by selecting Drill-down Group and use this group in dimension and in expression use sum of sales.
Regards,
Anand
- Mark as New
- Bookmark
- Subscribe
- Mute
- Subscribe to RSS Feed
- Permalink
- Report Inappropriate Content
Well,
Maybe I was not clear explaining it. That's exactly what I have right now and it's what I don't want. If I do that, I will have to drill down each value to get to the last level. My request is, Select the first level value and show all values at once.
Kind Regards
Julian
- Mark as New
- Bookmark
- Subscribe
- Mute
- Subscribe to RSS Feed
- Permalink
- Report Inappropriate Content
Hi,
Can you provide any sample for this by explaining this in any tables in forum it self.
Regards,
Anand
- Mark as New
- Bookmark
- Subscribe
- Mute
- Subscribe to RSS Feed
- Permalink
- Report Inappropriate Content
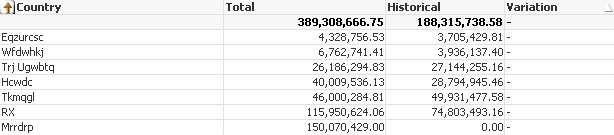
So this is what I mean,
This would be the top label view of the list:
And when the country is Selected, This fields should be shown:
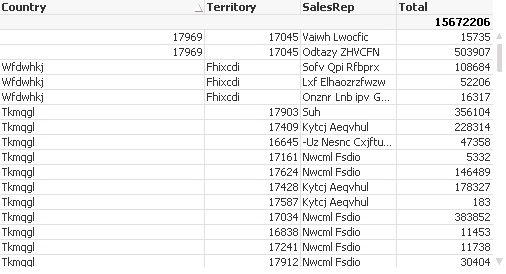
Any suggestions?
Thanks
Julian
- Mark as New
- Bookmark
- Subscribe
- Mute
- Subscribe to RSS Feed
- Permalink
- Report Inappropriate Content
Julian,
You can achieve this easily in version 11, as there is an option to have conditions on dimensions. On the other hand, version 10 (and older ones) do not have this flexibility. However, it can be achieved by having two charts with Show condition like IF(GetSelectedCount(Country)>0,1,0) .
Hope it helps