Unlock a world of possibilities! Login now and discover the exclusive benefits awaiting you.
- Qlik Community
- :
- All Forums
- :
- QlikView App Dev
- :
- EWMA - Regelkarte
Options
- Subscribe to RSS Feed
- Mark Topic as New
- Mark Topic as Read
- Float this Topic for Current User
- Bookmark
- Subscribe
- Mute
- Printer Friendly Page
Turn on suggestions
Auto-suggest helps you quickly narrow down your search results by suggesting possible matches as you type.
Showing results for
Not applicable
2012-11-29
02:47 AM
- Mark as New
- Bookmark
- Subscribe
- Mute
- Subscribe to RSS Feed
- Permalink
- Report Inappropriate Content
EWMA - Regelkarte
Hey!
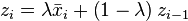
I would like to plot the following expression but I have some problems with the second therm:
 .
.
Here I copy the explanation of the formula:
"The EWMA chart computes successive observations zi by computing the rational subgroup average,  , and then combining that new subgroup average with the running average of all preceding observations, zi - 1, using the specially–chosen weight, λ."
My Data looks like this:
| Date | Value |
| 2012.01.03 16:03:55 | 0,41 |
| 2012.01.03 20:31:43 | 0,434 |
| 2012.01.03 23:13:58 | 0,42 |
| 2012.01.04 13:56:06 | 0,431 |
| 2012.01.04 16:21:06 | 0,455 |
| 2012.01.04 22:14:28 | 0,45 |
| 2012.01.04 22:20:31 | 0,437 |
| 2012.01.04 22:26:45 | 0,448 |
| 2012.01.04 22:35:22 | 0,437 |
| 2012.01.04 23:16:09 | 0,449 |
| 2012.01.11 10:10:07 | 0,449 |
| 2012.01.11 10:37:04 | 0,422 |
The subgroups must be "days".
Thank you very much!!! This chart is driving me crazy!
Eduardo
322 Views
0 Replies