Unlock a world of possibilities! Login now and discover the exclusive benefits awaiting you.
- Qlik Community
- :
- All Forums
- :
- QlikView App Dev
- :
- overlap chart line
Options
- Subscribe to RSS Feed
- Mark Topic as New
- Mark Topic as Read
- Float this Topic for Current User
- Bookmark
- Subscribe
- Mute
- Printer Friendly Page
Turn on suggestions
Auto-suggest helps you quickly narrow down your search results by suggesting possible matches as you type.
Showing results for
Creator II
2012-12-03
04:40 AM
- Mark as New
- Bookmark
- Subscribe
- Mute
- Subscribe to RSS Feed
- Permalink
- Report Inappropriate Content
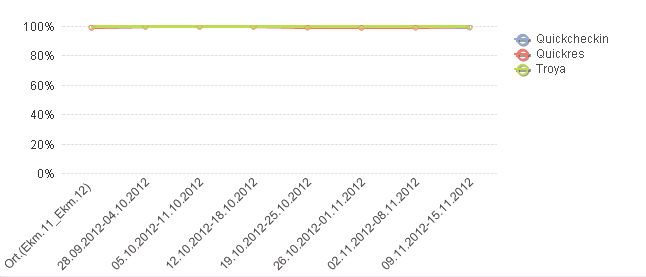
overlap chart line
Hi ,
I have line chart but expressions are overlapped How can I seperate these lines?
980 Views
5 Replies
Partner - Specialist
2012-12-03
04:52 AM
- Mark as New
- Bookmark
- Subscribe
- Mute
- Subscribe to RSS Feed
- Permalink
- Report Inappropriate Content
Hi,
You can use spilit axis in the axis tab for that.
Regards,
Nirav Bhimani
426 Views
Creator II
2012-12-03
05:37 AM
Author
- Mark as New
- Bookmark
- Subscribe
- Mute
- Subscribe to RSS Feed
- Permalink
- Report Inappropriate Content
I tried but İt didnt work as ı wanted
426 Views
Partner - Specialist
2012-12-03
07:00 AM
- Mark as New
- Bookmark
- Subscribe
- Mute
- Subscribe to RSS Feed
- Permalink
- Report Inappropriate Content
HI,
If possible then share your qvw.
Regards,
Nirav Bhimani
426 Views
Creator II
2012-12-03
07:19 AM
Author
- Mark as New
- Bookmark
- Subscribe
- Mute
- Subscribe to RSS Feed
- Permalink
- Report Inappropriate Content
Hi,
In Sheet 9 tab , You can see charts
426 Views
Anonymous
Not applicable
2012-12-03
07:56 AM
- Mark as New
- Bookmark
- Subscribe
- Mute
- Subscribe to RSS Feed
- Permalink
- Report Inappropriate Content
Hi,
Your data is like that all between 99 to 100 for all the three categories. If you want to see all the lines uncheck the "Forced 0" in properties under Axes tab.
Regards,
Nandha
426 Views