Unlock a world of possibilities! Login now and discover the exclusive benefits awaiting you.
- Qlik Community
- :
- All Forums
- :
- QlikView App Dev
- :
- Re: issue with Straight table when setting up back...
- Subscribe to RSS Feed
- Mark Topic as New
- Mark Topic as Read
- Float this Topic for Current User
- Bookmark
- Subscribe
- Mute
- Printer Friendly Page
- Mark as New
- Bookmark
- Subscribe
- Mute
- Subscribe to RSS Feed
- Permalink
- Report Inappropriate Content
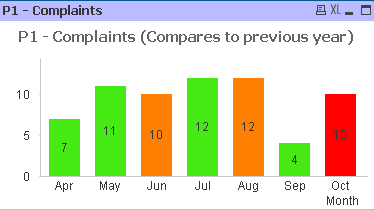
issue with Straight table when setting up background color
Hello Friends,
I am facing some issue with Straight table when setting up background color.
i am using the same expression which is used for bar chart for setting the background color. Its working fine with Bar chart( I think its because of the Dimension is
"Month" .
When i use this expression for Straight table, it is displaying the same background color for all the field values. I am not sure, what exactly the problem is?
Expression:
=if (Sum ({$<Year={$(#=Only(Year))}>} [P1 - Complaints]) < (Only(If(Ref='P1',RAGGreen)/100) * Sum ({$<Year={$(#=Only(Year)-1)}>} [P1 - Complaints])),RGB(69,234,21),if (Sum ({$<Year={$(#=Only(Year))}>} [P1 - Complaints]) <= Sum ({$<Year={$(#=Only(Year)-1)}>} [P1 - Complaints]), RGB(255,128,0), RGB(255,0,0)) )
Where 'Ref' and 'RAGGreen' are columns from RAG table.
For P1- Complaints, Ref='P1' and RAGGreen=90.
iam comparing the current year compaints with 90% of Previous years complaints in the expression.
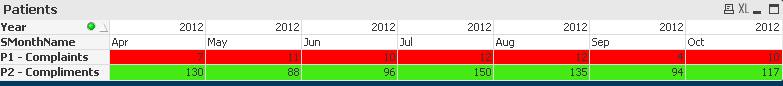
The columns in the Straight Table are displayed horizontally.
Regards
Siva
- Tags:
- new_to_qlikview
- Mark as New
- Bookmark
- Subscribe
- Mute
- Subscribe to RSS Feed
- Permalink
- Report Inappropriate Content
Hello sivadandu,
with the Pivot-table you cummulate the values according to the dimension Year.
So You have to use Aggr-function:
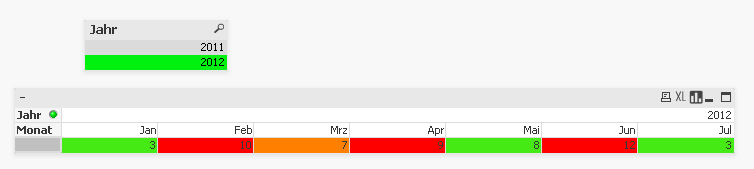
=
aggr(
if (Sum ({$<Jahr={$(=(Jahr))}>}Complaints ) < ( 90/100 * Sum ( {$<Jahr={$(=Jahr-1)}>} Complaints)),RGB(69,234,21),
if (Sum ({$<Jahr={$(=(Jahr))}>} Complaints) <= Sum ({$<Jahr={$(=Jahr-1)}>} Complaints), RGB(255,128,0), RGB(255,0,0) ))
,Monat)
Good Luck 