Unlock a world of possibilities! Login now and discover the exclusive benefits awaiting you.
- Qlik Community
- :
- All Forums
- :
- QlikView App Dev
- :
- Problem with total value
- Subscribe to RSS Feed
- Mark Topic as New
- Mark Topic as Read
- Float this Topic for Current User
- Bookmark
- Subscribe
- Mute
- Printer Friendly Page
- Mark as New
- Bookmark
- Subscribe
- Mute
- Subscribe to RSS Feed
- Permalink
- Report Inappropriate Content
Problem with total value
Hi All
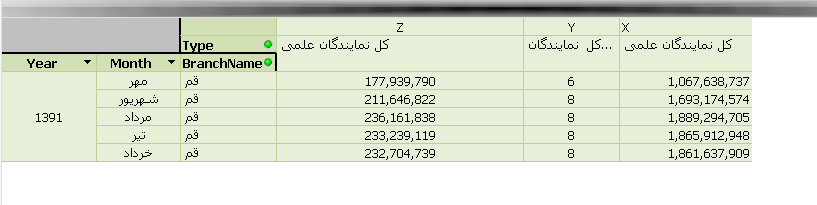
I Have problem with the total value for this type of dimension:
In this picture :
X : Main Value
Y : Count Value
Z : X/Y
How can I hav total value for Z value??
tnx All
Atefeh
Accepted Solutions
- Mark as New
- Bookmark
- Subscribe
- Mute
- Subscribe to RSS Feed
- Permalink
- Report Inappropriate Content
HI again
im sorry i was using X and Y as abstract example
when you use the aggr function you cannot use Column names that comes for the column names in the chart
you must use the actual names of the fields you are summing
like this
SUM(AGGR(SUM(Sale/Count),Year, Month,Branch,Type))
- Mark as New
- Bookmark
- Subscribe
- Mute
- Subscribe to RSS Feed
- Permalink
- Report Inappropriate Content
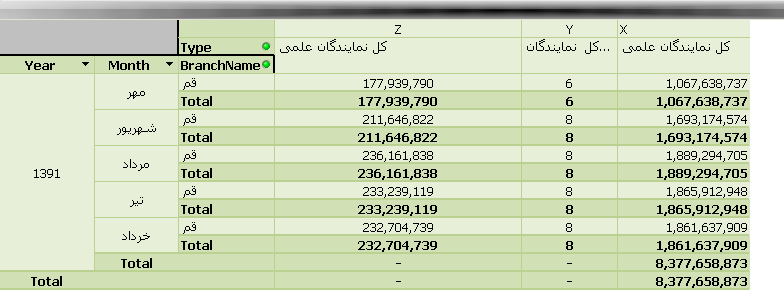
This is the result
beacause i have differnet value for "Y"
I want total for "Z"
- Mark as New
- Bookmark
- Subscribe
- Mute
- Subscribe to RSS Feed
- Permalink
- Report Inappropriate Content
hi
go to properties of chart ---- > presentation ---> select field then check on show patial sum
now if Z is take as dimension then sum automatically show.
if Z take as expression then in your expression write sum(Z) or sum(total(Z)) .
thanks.
- Mark as New
- Bookmark
- Subscribe
- Mute
- Subscribe to RSS Feed
- Permalink
- Report Inappropriate Content
Hi,
U need to write expression like below
Z: sum(X/Y)
go to properties of chart ---- > presentation ---> select field(Z) then check on show patial sum
Regards,
Kabilan K
- Mark as New
- Bookmark
- Subscribe
- Mute
- Subscribe to RSS Feed
- Permalink
- Report Inappropriate Content
Thanks Kabilan K
Sorry for this delay
sum(x/y) is not true,Caz:
Result: sum(X1+X2+X3...)/sum(Y1+Y2+Y3+....)
but i need this result : sum((x1/y1)+(x2/y2)+(X3/Y3)+.....)
plz help me on this

- Mark as New
- Bookmark
- Subscribe
- Mute
- Subscribe to RSS Feed
- Permalink
- Report Inappropriate Content
HI
what you ask for is "sum of rows".
this can be simply done in a striaght table where you can change the "total mode" of the expression from "expressions Total" to "sum of rows"
a pivot table allways uses "expressions Total"
to do what yu need in a pivot table it is only posible by the use of the AGGR() function
the aggr functions take an expression as its main paramter and one or more dimensions as its other paramters
and reuren a set of values from the expr aggregated over the dimensions.
and then you can use SUM() to aggregate these values
what you need to do is use:
sum(aggr(sum(x/y) , yourdimension1,yourdimension2,yourdimension3))
since you have more then one dimension in yoru sample
you can use the
Dimensionality ( ) and Secondarydimensionality ( ) functions to
determine what level of the pivot is open and use an if expressions to set the expression with the relevent dimesnions
hope that helps
Wizardo
- Mark as New
- Bookmark
- Subscribe
- Mute
- Subscribe to RSS Feed
- Permalink
- Report Inappropriate Content
Tnx Wizardo
But That s not true
I want total value to use in the bar chart
but the value is not correct
please check my sample ,
maybe it can helpp you

- Mark as New
- Bookmark
- Subscribe
- Mute
- Subscribe to RSS Feed
- Permalink
- Report Inappropriate Content
HI again
im sorry i was using X and Y as abstract example
when you use the aggr function you cannot use Column names that comes for the column names in the chart
you must use the actual names of the fields you are summing
like this
SUM(AGGR(SUM(Sale/Count),Year, Month,Branch,Type))
- Mark as New
- Bookmark
- Subscribe
- Mute
- Subscribe to RSS Feed
- Permalink
- Report Inappropriate Content
Completely True
Thanks alotttttttttttttt
