Unlock a world of possibilities! Login now and discover the exclusive benefits awaiting you.
- Qlik Community
- :
- All Forums
- :
- QlikView App Dev
- :
- Re: Forecasting Trend Information
- Subscribe to RSS Feed
- Mark Topic as New
- Mark Topic as Read
- Float this Topic for Current User
- Bookmark
- Subscribe
- Mute
- Printer Friendly Page
- Mark as New
- Bookmark
- Subscribe
- Mute
- Subscribe to RSS Feed
- Permalink
- Report Inappropriate Content
Forecasting Trend Information
Hi All,
Been scratching my head over this one this morning. I am currently trying to figure out how to generate trend figures for 2013 based on some figures I've made up for 2012.
I know I can set the chart I'm using to draw a trend line and extend this out for another 12 month (although it doesn't show the x axis values) and also I've read some posts on using linest functions but I'm guessing I can't use these in the script. Ideally I would like to be able to generate actual rows using script to determine these values.
I have attached the qvw I've started playing around with. If anyone has any help it would be appreciated.
Regards,
Chris
- Mark as New
- Bookmark
- Subscribe
- Mute
- Subscribe to RSS Feed
- Permalink
- Report Inappropriate Content
hi,
In your Data Model the Row Type(Actual) didnt have the 2013 data, and if you need 2013 data neglect the set analysis.I think this is the problem for your issue.
- Mark as New
- Bookmark
- Subscribe
- Mute
- Subscribe to RSS Feed
- Permalink
- Report Inappropriate Content
Hi,
Yes, you are correct in that the set analysis will need to be changed. It is only currently filtering on Acutal values at the moment as I was trying a few things out.
My plan, once I work out how to create Trend rows in script is to then have the user be able to choose between showing an Average/Profile/Trend forecast figure.
Chris
- Mark as New
- Bookmark
- Subscribe
- Mute
- Subscribe to RSS Feed
- Permalink
- Report Inappropriate Content
Chris
I am not sure if this is what you are looking for :
1 - Copy the chart (Right click -> Clone)
2 - Go to the calculated dimension and change the formula to = date(AddMonths(Month,12),'MMM-YY')
3 - Let us assume that 2013's forecast is 15% more than 2012. Change the expression to :
sum({<RowType={'Actual'}>}B*1.15)
Attached a a graphic as illustration.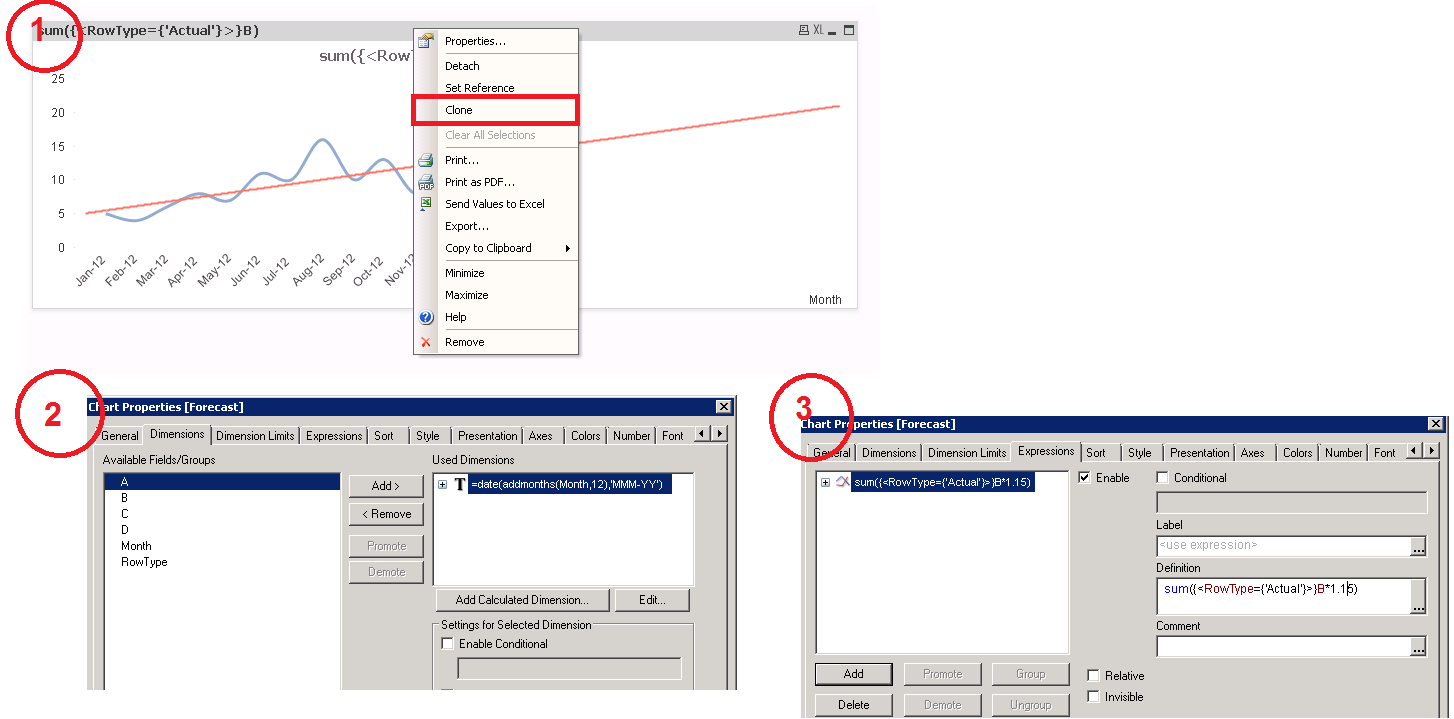
I hope this helps!
Regards
MultiView
- Mark as New
- Bookmark
- Subscribe
- Mute
- Subscribe to RSS Feed
- Permalink
- Report Inappropriate Content
Did u elabrate the task again, i just confused with your words.
- Mark as New
- Bookmark
- Subscribe
- Mute
- Subscribe to RSS Feed
- Permalink
- Report Inappropriate Content
Yes, sure.
I have figures for a product for 2012.
I would like to create figures for 2013 based on 3 different scenarios.
1. Profile - This is just taking 2012 figures and using the same values for 2013. I have done this.
2. Average - This is taking the average figure across 2012 and using this for each month in 2013. I have done this also.
3. Trend - This is the one I am having difficulty with. I believe I need to find out what the Trend is for 2012 (possibly by calculating the slope of the Trend line) and then extend this for 2013. You can see this roughly by looking at the trend line on my chart for 2012 and then ticking the Forecast button on the chart properties and entering 12, to get a further 12 months added.
I would like to calculate the values for a 2013 trend line, based on the trend line for 2012 so that I can put these rows in the original table for 2013.
I now believe that I need to find out the slope for the trend line for 2012 and apply this somehow to the original 2012 data.
I'm not sure if this makes it clearer or just more confusing!
- Mark as New
- Bookmark
- Subscribe
- Mute
- Subscribe to RSS Feed
- Permalink
- Report Inappropriate Content
I think this is the think u want
- Mark as New
- Bookmark
- Subscribe
- Mute
- Subscribe to RSS Feed
- Permalink
- Report Inappropriate Content
Hi,
Right, I think I've got about half way through. Done a lot of the hard maths work to calculate trend figures for the following 12 months for 1 of the products. The next task is to loop through the other products but I'm happy with what I have so far.
Feel free to have a look. If you want to see what I used as a reference for the formulae used then look at the below link:
http://www.ehow.com/how_6739766_calculate-trend-lines.html
Chris