Unlock a world of possibilities! Login now and discover the exclusive benefits awaiting you.
- Qlik Community
- :
- All Forums
- :
- QlikView App Dev
- :
- Re: Help with the Average
- Subscribe to RSS Feed
- Mark Topic as New
- Mark Topic as Read
- Float this Topic for Current User
- Bookmark
- Subscribe
- Mute
- Printer Friendly Page
- Mark as New
- Bookmark
- Subscribe
- Mute
- Subscribe to RSS Feed
- Permalink
- Report Inappropriate Content
Help with the Average
Hi everyone.
I am trying to put the Average as a column (call it B) rather than a row in a pivot table. But the other expression (sales, volume) stay the same.
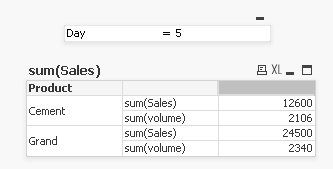
This is the table I have now:
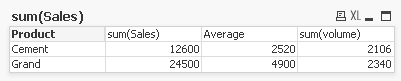
If it is possible, I would like my table look like
| Product | XXX | Average | |
|---|---|---|---|
| Cement | sum(sales) | 12600 | 2520 |
| Cement | Sum(volume) | 2106 | 421.2 |
| Grand | sum(sales) | 24500 | 4900 |
Right now, the dimension is "Product", all the rest are expressions. May be the final table can be achieved somehow?
Thank you very much for your help.
Roger.
- « Previous Replies
-
- 1
- 2
- Next Replies »
Accepted Solutions
- Mark as New
- Bookmark
- Subscribe
- Mute
- Subscribe to RSS Feed
- Permalink
- Report Inappropriate Content
Hi Roger,
My bad! I didn't do enough testing in my previous post. I have changed the method but I have realised that you wanted to use Pivot Table only. So I have tweaked the expression little and updating the new version.
Also, just for your understanding - Synthetic Dimensions can be linked to the expression. But we can't link one Synthetic Dimension to another one. Hence I had changed my approach. And you can really optimize your expression if you have dynamic list. If its few values as part of Synthetic Dimension then you can hard code them otherwise you need to use ValueLoop() and Concat() to build the strings. I hope all this makes sense.
Let me know if this is what you wanted to see...
Thanks,
DV
- Mark as New
- Bookmark
- Subscribe
- Mute
- Subscribe to RSS Feed
- Permalink
- Report Inappropriate Content
Sorry. My table looks like follows.
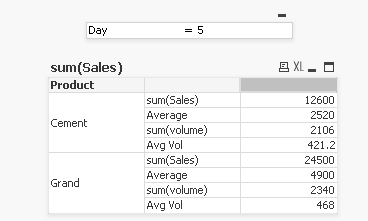
Right now, I can only put the average one by one:
My desired table is
| Product | XXX | Average | |
|---|---|---|---|
| Cement | sum(sales) | 12600 | 2520 |
| Cement | Sum(volume) | 2106 | 421.2 |
| Grand | sum(sales) | 24500 | 4900 |
Any ideas?
Thank you.
- Mark as New
- Bookmark
- Subscribe
- Mute
- Subscribe to RSS Feed
- Permalink
- Report Inappropriate Content
Hi Roger,
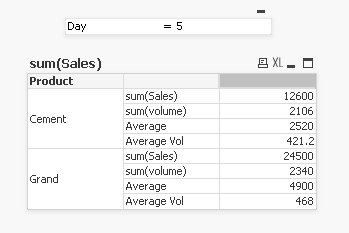
Assuming that you want something like attached? Just wanted to make sure...
I shall mock up something as your desired table but just wanted to check if this works?
Thanks,
DV
- Mark as New
- Bookmark
- Subscribe
- Mute
- Subscribe to RSS Feed
- Permalink
- Report Inappropriate Content
Hi Deepak.
Thanks for your reply.
It is not really what I wanted. I know you can drag dimensions and expressions in pivot table. But when I drag it, all the expressions (sum(sales), average, sum(volume) all moved together
But could you somehow move the average alone so that the table looks like my desired table?
Because I want to export to excel later. That's the format people want.
Thanks.
- Mark as New
- Bookmark
- Subscribe
- Mute
- Subscribe to RSS Feed
- Permalink
- Report Inappropriate Content
Here is the updated version. Please check both Version 1 & 2 and use whatever suits your requirement. Although Synthetic Dimensions are very effiecient with large datasets. And there is lot of CPU overhead for Synthetic Dimensions compared to regular Dimensions.
I hope this helps!
Cheers,
DV
- Mark as New
- Bookmark
- Subscribe
- Mute
- Subscribe to RSS Feed
- Permalink
- Report Inappropriate Content
Hi DV.
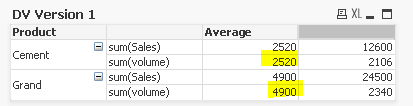
The Aggr function looks great. It almost achieves the desired table. I have checked both Version 1 & 2. It is very close to what I want. You use the following in calculated dimension:
Aggr(sum(Sales)/Day, Product)
But this will only give you the average of the Sales right. However, the average of the volume is not shown at the place I highlighted. If I use this aggr approach in the calculated dimension, the average for the sum(volume) is not correct.
It would be very nice it the "Average" column can show the average of every individual expression.
Thank you very much.
Roger.
- Mark as New
- Bookmark
- Subscribe
- Mute
- Subscribe to RSS Feed
- Permalink
- Report Inappropriate Content
Hi DV.
I wish in the presentation tab, there is a selection "partial average" or a field where you can add the expression, just like the "partial sum" we have right now.
If I want the sum instead of calculated average, the selection of "partial sum" already does the work.
Hope this helps to demonstrate what I expect.
Thank you for your time.
- Mark as New
- Bookmark
- Subscribe
- Mute
- Subscribe to RSS Feed
- Permalink
- Report Inappropriate Content
Hi Roger,
My bad! I didn't do enough testing in my previous post. I have changed the method but I have realised that you wanted to use Pivot Table only. So I have tweaked the expression little and updating the new version.
Also, just for your understanding - Synthetic Dimensions can be linked to the expression. But we can't link one Synthetic Dimension to another one. Hence I had changed my approach. And you can really optimize your expression if you have dynamic list. If its few values as part of Synthetic Dimension then you can hard code them otherwise you need to use ValueLoop() and Concat() to build the strings. I hope all this makes sense.
Let me know if this is what you wanted to see...
Thanks,
DV
- Mark as New
- Bookmark
- Subscribe
- Mute
- Subscribe to RSS Feed
- Permalink
- Report Inappropriate Content
Hi DV.
Awesome!!!
The Synthetic Dimension is something I did not know at all. But your new reply works perfect!
Also thank you for your suggstion about the valueloop and concat. I need to look into it.
I learnt new things today.
Your help is very much appreciated.
Best regards.
Roger
- Mark as New
- Bookmark
- Subscribe
- Mute
- Subscribe to RSS Feed
- Permalink
- Report Inappropriate Content
Most welcome Roger. I'm glad you got what you wanted!
Do you mind if I use your example and create a video on my blog explaining Synthetic Dimensions & other stuff we've discuss here? It helps other users...
Thanks,
DV
- « Previous Replies
-
- 1
- 2
- Next Replies »