Unlock a world of possibilities! Login now and discover the exclusive benefits awaiting you.
- Qlik Community
- :
- All Forums
- :
- QlikView Integrations
- :
- Re: OpenStreetMap Extension Object
- Subscribe to RSS Feed
- Mark Topic as New
- Mark Topic as Read
- Float this Topic for Current User
- Bookmark
- Subscribe
- Mute
- Printer Friendly Page
- Mark as New
- Bookmark
- Subscribe
- Mute
- Subscribe to RSS Feed
- Permalink
- Report Inappropriate Content
OpenStreetMap Extension Object
This is an extension object which I made out of Alexander Karlsson's Google Map extension:
http://community.qlik.com/message/153412
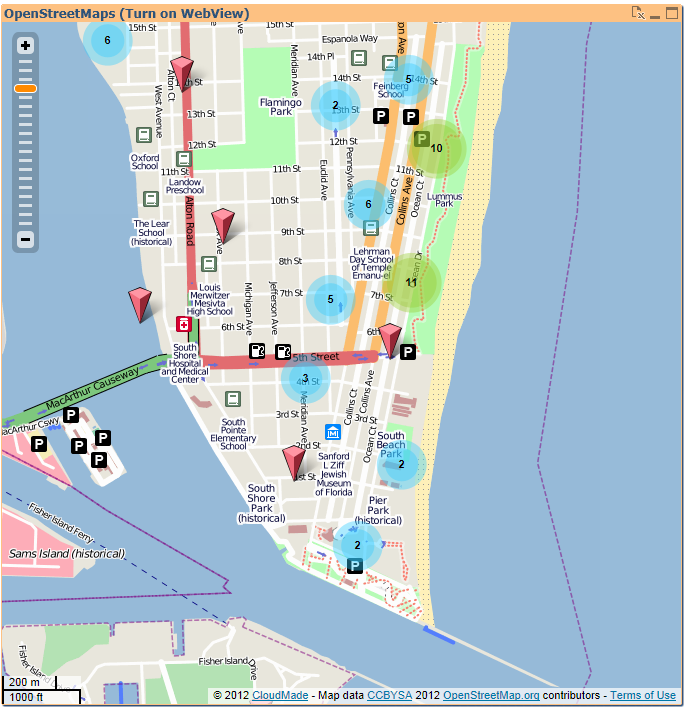
It uses the CloudMade.com Web API to display OpenStreetMap tiles. This is a first version with marker custers and automate positioning dependend from the data selection. You can zoom and drag inside the map.
The extension needs Lat/Long as dimension and a marker label as expression, as you can see in my demo app. It was tested with QV11.
Any feedback is very welcome!
- Ralf
Caution: I have to mention here that a demo API key is used in the extension. If you realy want to use this in a production environment you should get your own personal API key at: www.cloudmade.com
Update: Alexander and I have improved slightly. Now you can enter the API key in the properties pane and you can switch the markers clustering
- Mark as New
- Bookmark
- Subscribe
- Mute
- Subscribe to RSS Feed
- Permalink
- Report Inappropriate Content
Hi,
We are trying to use the above map in our Qlikvie wDashboard. We are facing the issues as of how to refer to the data. We are getting the below error.
TIQ Solutions JSON proxy is not running on http://localhost:8477!
May be because that is the localhost and we cannot access the same. Can you suggest how to load the data using our latitude and longitude values from our own database?
This would really help us.
Thanks in Advance
M.Santosh Kumari
- Mark as New
- Bookmark
- Subscribe
- Mute
- Subscribe to RSS Feed
- Permalink
- Report Inappropriate Content
Hi,
the JSON Proxy is a separate solution provided by TIQ Solutions to load JSON data from Web sources into QlikView:
http://www.tiq-solutions.de/display/enghome/ENJSON
I think this is not need it in your case. You can load your data from your database in the QlikView Load Script (CONNECT, SELECT). Then just use the extension map object in your dashboard with your data.
- Ralf
- Mark as New
- Bookmark
- Subscribe
- Mute
- Subscribe to RSS Feed
- Permalink
- Report Inappropriate Content
Thank you for the reply.
But im not sure of how to load the data. I have the following fields : Latitude, Longitude, State, City and PropertyType.
Can you provide us with a sample?
Do i have to comment out all the lines that refer to the json ?
Regards,
M.Santosh Kumari
- Mark as New
- Bookmark
- Subscribe
- Mute
- Subscribe to RSS Feed
- Permalink
- Report Inappropriate Content
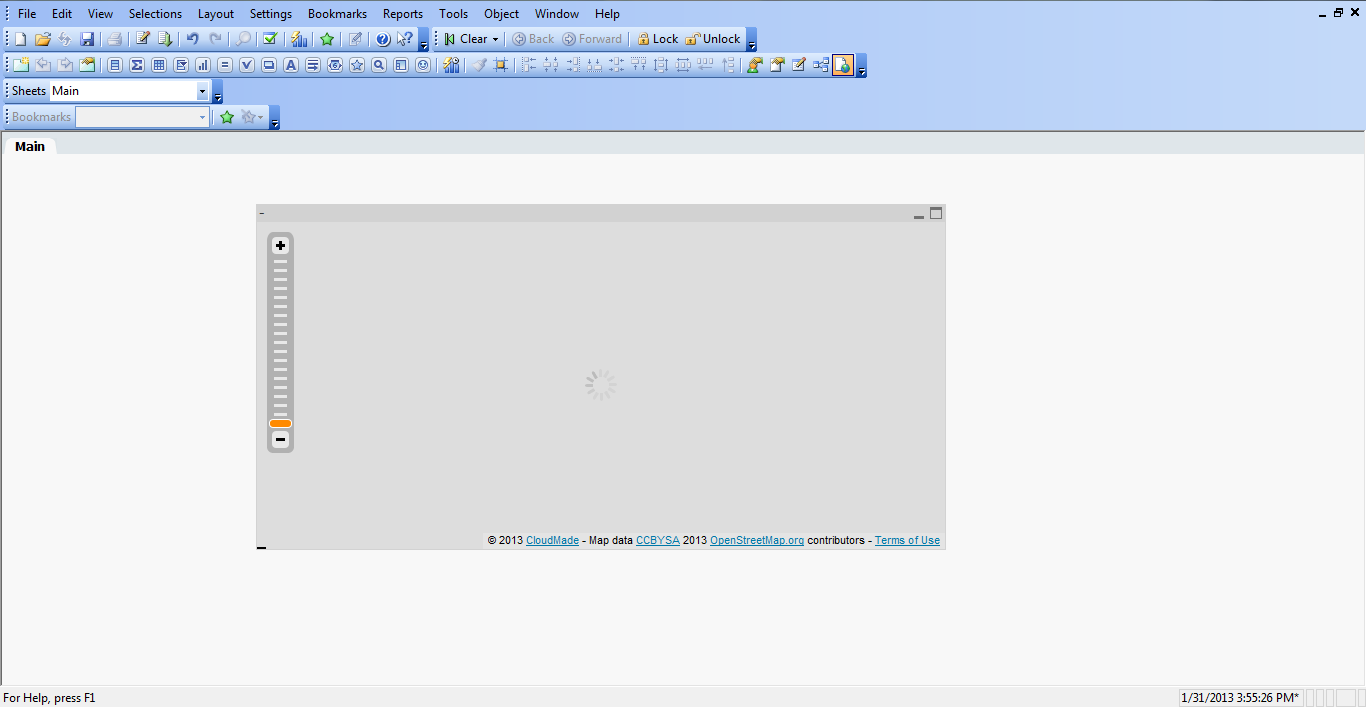
As I wrote, you have to create a new QlikView application with a Load Script. After you have loaded the data you can add the extension (activate web view) and assign the data fields to the extension fields.
If you're not able to do this, send me your data and I can build up an example:
- Ralf
- Mark as New
- Bookmark
- Subscribe
- Mute
- Subscribe to RSS Feed
- Permalink
- Report Inappropriate Content
Hi,
I made the changes as you have mentioned in your post. But unfortunately the map is not being loaded.
Please find the attached qvw and the excel file i am refering to.
| city | latitude | longitude | state | ZIPCODE | name |
| Houston | 30.0453028 | -95.2091124 | Texas | 76548 | Santosh |
| New York | 40.5950865 | -73.9784718 | New York | 76547 | Kumari |
| San Jose | 37.3031253 | -121.9211007 | California | 76549 | TEST |
Thanks,
M.Santosh Kumari
- Mark as New
- Bookmark
- Subscribe
- Mute
- Subscribe to RSS Feed
- Permalink
- Report Inappropriate Content
Please send me the QVW and Excel file. I can do nothing with a picture..
- Mark as New
- Bookmark
- Subscribe
- Mute
- Subscribe to RSS Feed
- Permalink
- Report Inappropriate Content
Hi,
Sorry for that...please find the attached files.
Thanks,
Santosh Kumari
- Mark as New
- Bookmark
- Subscribe
- Mute
- Subscribe to RSS Feed
- Permalink
- Report Inappropriate Content
Hey,
This works all of a sudden 
Thanks a lot.
M.Santosh Kumari
- Mark as New
- Bookmark
- Subscribe
- Mute
- Subscribe to RSS Feed
- Permalink
- Report Inappropriate Content
Hey Ralf, as of now i am able to zoom limited to the Country, im not able to zoom into further details, like neighbourhood and Building. How can we achieve that?
Also Can change the icon shape and color?
Best,
M.Santosh Kumari
- Mark as New
- Bookmark
- Subscribe
- Mute
- Subscribe to RSS Feed
- Permalink
- Report Inappropriate Content
I can zoom in on street level with your uploaded QVW. You can change the marker icon with the JavaScript API:
http://developers.cloudmade.com/projects/web-maps-api/examples/custom-map-markers
Btw. the map seems have more details (buildings etc.) on European locations..