Unlock a world of possibilities! Login now and discover the exclusive benefits awaiting you.
- Qlik Community
- :
- All Forums
- :
- QlikView App Dev
- :
- Re: Filter Dimension Values
- Subscribe to RSS Feed
- Mark Topic as New
- Mark Topic as Read
- Float this Topic for Current User
- Bookmark
- Subscribe
- Mute
- Printer Friendly Page
- Mark as New
- Bookmark
- Subscribe
- Mute
- Subscribe to RSS Feed
- Permalink
- Report Inappropriate Content
Filter Dimension Values
Hi,
I've got a 200 rows file containing the following columns:
State
Population
I would like to create a Bar Chart containing only the "top 10" states instead of including 200 bars
How should I proceed?
Thanks in advance
Accepted Solutions
- Mark as New
- Bookmark
- Subscribe
- Mute
- Subscribe to RSS Feed
- Permalink
- Report Inappropriate Content
Hi.
You can do it if you use version 11 in chart properties
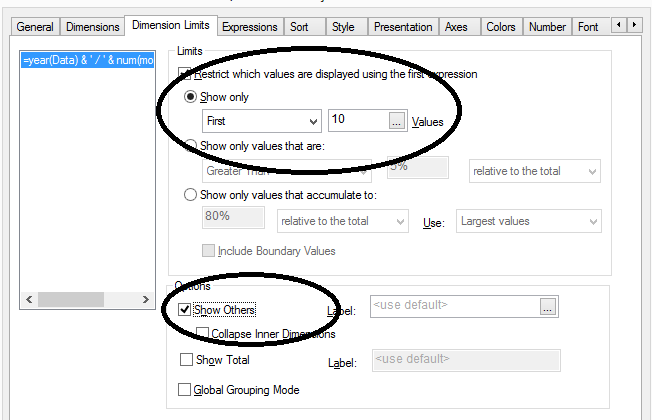
In this case, will show the others too. Uncheck it if you don't want.
Alessandro Furtado
Alessandro Furtado
- Mark as New
- Bookmark
- Subscribe
- Mute
- Subscribe to RSS Feed
- Permalink
- Report Inappropriate Content
In the chart properties, go to the Dimension Limit tab (the third one) and select Top 10 by Larger values.
JG
- Mark as New
- Bookmark
- Subscribe
- Mute
- Subscribe to RSS Feed
- Permalink
- Report Inappropriate Content
Hi.
You can do it if you use version 11 in chart properties
In this case, will show the others too. Uncheck it if you don't want.
Alessandro Furtado
Alessandro Furtado