Unlock a world of possibilities! Login now and discover the exclusive benefits awaiting you.
- Qlik Community
- :
- All Forums
- :
- QlikView App Dev
- :
- Re: Data presentation with several Dimensions
- Subscribe to RSS Feed
- Mark Topic as New
- Mark Topic as Read
- Float this Topic for Current User
- Bookmark
- Subscribe
- Mute
- Printer Friendly Page
- Mark as New
- Bookmark
- Subscribe
- Mute
- Subscribe to RSS Feed
- Permalink
- Report Inappropriate Content
Data presentation with several Dimensions
Hello dear community
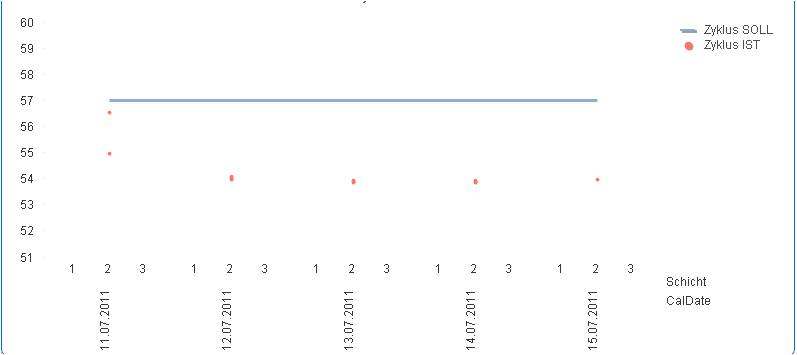
I have 2 Dimensions and unfortumnatly the data is linked/connected to the first dimension. You can see that on every date three values are explained. These values
should be connected to the second dimension. Can you tell me what am I doing wrong??
cheers
- Mark as New
- Bookmark
- Subscribe
- Mute
- Subscribe to RSS Feed
- Permalink
- Report Inappropriate Content
There are some limitations in QV using a line chart with multiple dimensions and multiple expressions.
Maybe you can use use one dimension only (e.g. by using a concatenation of your two current dimensions).
If you upload a small sample application, we can have a closer look and probably one member of the community can suggest a better solution.
- Mark as New
- Bookmark
- Subscribe
- Mute
- Subscribe to RSS Feed
- Permalink
- Report Inappropriate Content
well..
I also figured it out yesterday:
basically I have to merge two dimensions
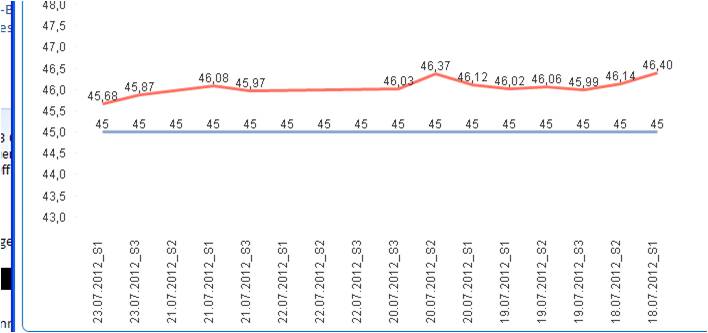
- but it really doesnt look nice...
Thx anyway
chesterluck