Unlock a world of possibilities! Login now and discover the exclusive benefits awaiting you.
- Qlik Community
- :
- All Forums
- :
- QlikView App Dev
- :
- Re: Aggr within set analysis
- Subscribe to RSS Feed
- Mark Topic as New
- Mark Topic as Read
- Float this Topic for Current User
- Bookmark
- Subscribe
- Mute
- Printer Friendly Page
- Mark as New
- Bookmark
- Subscribe
- Mute
- Subscribe to RSS Feed
- Permalink
- Report Inappropriate Content
Aggr within set analysis
Dear All,
I have some plants taking products from factories. Factories have different production slots(buck) for producing products. Now I have to show in a chart
Plant,Factory, product and production value of max buck/slot.
I am using Aggr(Max(buck),Factory,product) in a set analysis, but it does not work.
Please find the attached qvw file that describes the problem.
Any help would be highly appreceated.
Thanks & Regards,
Som
- Mark as New
- Bookmark
- Subscribe
- Mute
- Subscribe to RSS Feed
- Permalink
- Report Inappropriate Content
Try FirstSortedValue(prod_val,-buck). This will work as long as there's only one maximum buck value per plant-factory-product combination.
talk is cheap, supply exceeds demand
- Mark as New
- Bookmark
- Subscribe
- Mute
- Subscribe to RSS Feed
- Permalink
- Report Inappropriate Content
Thanks for your reply.
In our requirement, each factory can have multiple buck/slots(e.g 1,2,3,4,..,n) for production. Plants take products from Factories. Thus we can say plant-factory-product combination have multiple bucks.
The attached image shows the table structure.
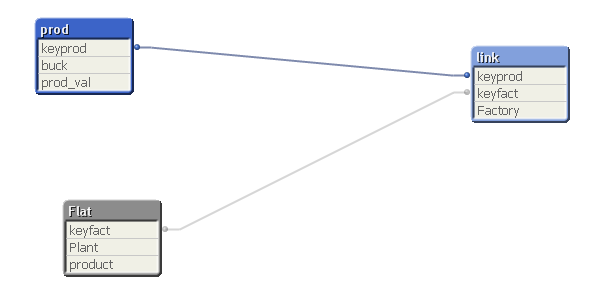
keyprod : factory + product
keyfact : plant + product
Pls suggest if you think any better table model.
Regards,
Som
- Mark as New
- Bookmark
- Subscribe
- Mute
- Subscribe to RSS Feed
- Permalink
- Report Inappropriate Content
You could do some calculations in the script to find the max prod_val of the max buck. See attached qvw.
talk is cheap, supply exceeds demand
- Mark as New
- Bookmark
- Subscribe
- Mute
- Subscribe to RSS Feed
- Permalink
- Report Inappropriate Content
Thanks for your solution. But still I am facing the problem if I have to show :
production(max(buck)) , production(max(buck) - 1) and production(max(buck) - 2).
Actually in our real scenario script level calculation would not be acceptable as script level max prod_val calculation grouping over lots of dimensions would be very difficult (in terms of time and also expression writting).
Regards,
Som