Unlock a world of possibilities! Login now and discover the exclusive benefits awaiting you.
- Qlik Community
- :
- All Forums
- :
- QlikView App Dev
- :
- Inter annual - Z Graphic
Options
- Subscribe to RSS Feed
- Mark Topic as New
- Mark Topic as Read
- Float this Topic for Current User
- Bookmark
- Subscribe
- Mute
- Printer Friendly Page
Turn on suggestions
Auto-suggest helps you quickly narrow down your search results by suggesting possible matches as you type.
Showing results for
Not applicable
2013-02-21
10:00 AM
- Mark as New
- Bookmark
- Subscribe
- Mute
- Subscribe to RSS Feed
- Permalink
- Report Inappropriate Content
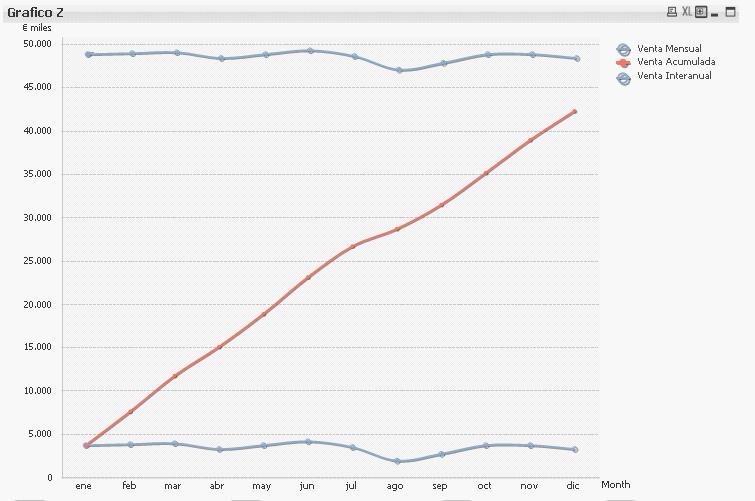
Inter annual - Z Graphic
Hi all,
Some one has developed a Z Graphic?
In this graphic type there are combined 3 expressions:
- value for month
- value acumulative
- value interannual
The two first expressions are easy, but how I can obtain the interannual value?
This is the acumulative value of last 12 months.
Thanks in advance.
Mike
193 Views
1 Reply
2013-02-21
10:11 AM
- Mark as New
- Bookmark
- Subscribe
- Mute
- Subscribe to RSS Feed
- Permalink
- Report Inappropriate Content
You'll need an AsOf table for that I think. See here for an example.
talk is cheap, supply exceeds demand