Unlock a world of possibilities! Login now and discover the exclusive benefits awaiting you.
- Qlik Community
- :
- All Forums
- :
- QlikView App Dev
- :
- What if Analysis for Net Sales Forecast
- Subscribe to RSS Feed
- Mark Topic as New
- Mark Topic as Read
- Float this Topic for Current User
- Bookmark
- Subscribe
- Mute
- Printer Friendly Page
- Mark as New
- Bookmark
- Subscribe
- Mute
- Subscribe to RSS Feed
- Permalink
- Report Inappropriate Content
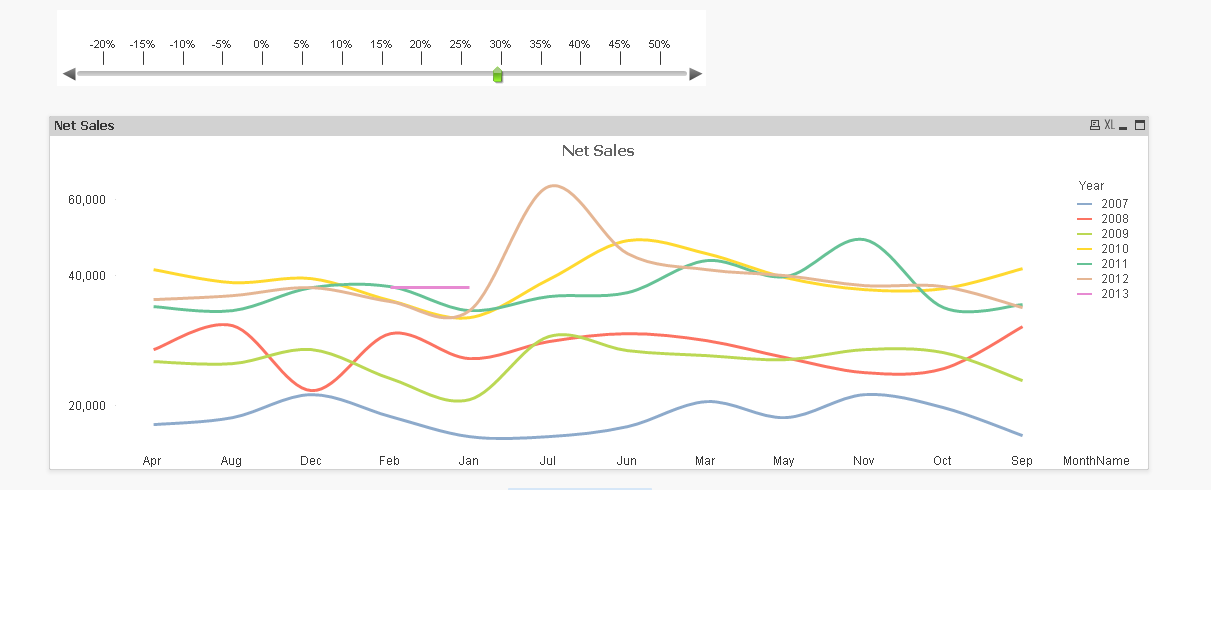
What if Analysis for Net Sales Forecast
Hi,
I have 5 year sales data. Now i want to do what if-analysis for the same.
For Example:
If 2013 jan net sale is 500 and feb is 2000.I used one slider form (-20 to 20) as vPrice.
I took month in dimension and expression as Sum(NetSales)*vPrice
Now, 2013 only has data for jan and feb but when i use the slider, it should automatically take the last year netsales amount and multiply by vPrice automatically till december.
example: Feb Net sales is 2000, so for march Sales= 2000*vPrice, April Sales =2000*vPrice ...Dec Sales = 2000*vPrice
Thanks,
Selva
Accepted Solutions
- Mark as New
- Bookmark
- Subscribe
- Mute
- Subscribe to RSS Feed
- Permalink
- Report Inappropriate Content
See attached qvw for an example.
talk is cheap, supply exceeds demand
- Mark as New
- Bookmark
- Subscribe
- Mute
- Subscribe to RSS Feed
- Permalink
- Report Inappropriate Content
See attached qvw for an example.
talk is cheap, supply exceeds demand
- Mark as New
- Bookmark
- Subscribe
- Mute
- Subscribe to RSS Feed
- Permalink
- Report Inappropriate Content
hi Gysbert,
I'm a newbie and trying to learn 
1. What is in the Include file?
2. where is 'qvc.calendarfromfield '.
thank you!
- Mark as New
- Bookmark
- Subscribe
- Mute
- Subscribe to RSS Feed
- Permalink
- Report Inappropriate Content
hi Gysbert,
I'm a newbie and trying to learn
1. What is in the Include file?
2. where is 'qvc.calendarfromfield '.
thank you!
- Mark as New
- Bookmark
- Subscribe
- Mute
- Subscribe to RSS Feed
- Permalink
- Report Inappropriate Content
hi Gysbert,
I'm a newbie and trying to learn
1. What is in the Include file?
2. where is 'qvc.calendarfromfield '.
- Mark as New
- Bookmark
- Subscribe
- Mute
- Subscribe to RSS Feed
- Permalink
- Report Inappropriate Content
hi Gysbert,
I'm a newbie and trying to learn
1. What is in the Include file?
2. where is the QVC.includefromcalenderfrom field you are using?
- Mark as New
- Bookmark
- Subscribe
- Mute
- Subscribe to RSS Feed
- Permalink
- Report Inappropriate Content
hi Gysbert,
I'm a newbie and trying to learn
1. What is in the Include file?
2. where is the QVC.includefromcalenderfrom field you are using?
- Mark as New
- Bookmark
- Subscribe
- Mute
- Subscribe to RSS Feed
- Permalink
- Report Inappropriate Content
The include file is the Qlikview Components library. See here for a tutorial for the calendarfromfield bit.
talk is cheap, supply exceeds demand
- Mark as New
- Bookmark
- Subscribe
- Mute
- Subscribe to RSS Feed
- Permalink
- Report Inappropriate Content
Hi Gysbert,
In my case, X axis is month and it has 5 years, so i cannot hard code the year and the few years will have 3 months data and few years will have 12 month data
For projection, last month data can be taken for the forecast along with slider value
For Year 2013, Data is there for Jan,Feb.
If i change the slider, from Mar to Dec dotted line should come and obviously Jan and Feb data will also change accordingly based on slider value and for other years also it should change accordingly.
Thanks,
Selva