Unlock a world of possibilities! Login now and discover the exclusive benefits awaiting you.
- Qlik Community
- :
- All Forums
- :
- QlikView App Dev
- :
- Re: Simple Inter-record query
- Subscribe to RSS Feed
- Mark Topic as New
- Mark Topic as Read
- Float this Topic for Current User
- Bookmark
- Subscribe
- Mute
- Printer Friendly Page
- Mark as New
- Bookmark
- Subscribe
- Mute
- Subscribe to RSS Feed
- Permalink
- Report Inappropriate Content
Simple Inter-record query
I would like to determine the simple % change in price between one record set and another (between one day and the next), and ideally chart this. However I'm struggling to do this. I can do this in the qvd as part of the sql, but prefer to do it in the qvw as part of the expression.
( ClosingPrice[Current] - ClosingPrice[PreviousDay] )/ClosingPrice(PreviousDay)
On the current record, I'm attempting to query the previous price using the following expression. The expression is for a specific instrument, using the MakeDate function, using LadderYear, LadderMonth and LadderDay as the previous recorde date for that instrument. But this returns NULL value.
=avg(
{$<Instrument1={$(='[DOE Annual World Oil Demand]')}, LadderDate={$(=MakeDate($(LadderYear),$(LadderMonth),$(LadderDay))) }>} ClosingPriceUSD1
)
I have also tried the function Last. This also returns NULL value.
=Last( {$<Instrument1={$(='[DOE Annual World Oil Demand]')}>} ClosingPriceUSD1 )
I'm missing something fundamental here, as I would have thought this to be relatively simple to do. Any guidance people can offer, will be greatly appretciated.
Many thanks
- « Previous Replies
-
- 1
- 2
- Next Replies »
- Mark as New
- Bookmark
- Subscribe
- Mute
- Subscribe to RSS Feed
- Permalink
- Report Inappropriate Content
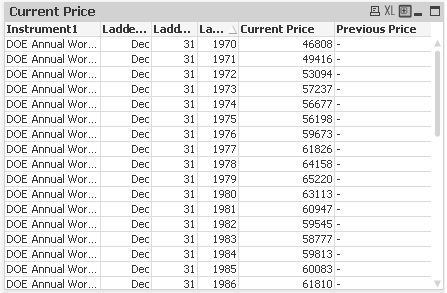
I really appretciate your help and suggestions. I tried to rearrange the dimensions as suggested and once again it just doesn't seem to like the previous price. I'm either doing something so silly or it's fundementally wrong.
The only data set I have are 31st Dec for each year - there is no pricing during the year for this particular instrument. So rearranging the dimension have no effect. I even replaced the Month,Day, Year with a simple date and of course that had the same effect.
I've done some relatively complex charts with Qlikview and I would have thought a % change in any value over a period is relatively simple to do. Maybe i should rename Discussion as "Not so simple inter-record query".
If setanalysis works with Last, Above, it must be something in my expression that it doesn't like. Does it matter on the order whether I do Above(sum(......)) or Sum(above(.....))?

- Mark as New
- Bookmark
- Subscribe
- Mute
- Subscribe to RSS Feed
- Permalink
- Report Inappropriate Content
Okay, I actually played around with my data to see what was going on.
Basically, it looks like your Instrument1 isn't changing. If you had 2 different instrument1s, you'd have a table like this:
Instrument, date, current price, previous
DOE A, dec31 1970, 46808, -
DOE B, dec31 1970, 46707,46808
Unfortunately, it doesn't look like this is dependent on the order the dimensions are in. In a pivot table, it would be, but this is a straight table.
If you make separate tables for each instrument (which might be easier to read anyways, given how large a period of time your data spans) and just use date as a field rather than month/day/year, I think that'll do it.
It's really too bad Qlikview can't get charts to run off of pivot tables rather than straight tables. It'd be much more intuitive.
- Mark as New
- Bookmark
- Subscribe
- Mute
- Subscribe to RSS Feed
- Permalink
- Report Inappropriate Content
Alternately, this person seemed to create a weird date alias to get around the same problem. It's common, if it makes you feel any better!
- « Previous Replies
-
- 1
- 2
- Next Replies »