Unlock a world of possibilities! Login now and discover the exclusive benefits awaiting you.
- Qlik Community
- :
- All Forums
- :
- QlikView App Dev
- :
- Re: Adding an Average reference line to a bar char...
- Subscribe to RSS Feed
- Mark Topic as New
- Mark Topic as Read
- Float this Topic for Current User
- Bookmark
- Subscribe
- Mute
- Printer Friendly Page
- Mark as New
- Bookmark
- Subscribe
- Mute
- Subscribe to RSS Feed
- Permalink
- Report Inappropriate Content
Adding an Average reference line to a bar chart
Hi,
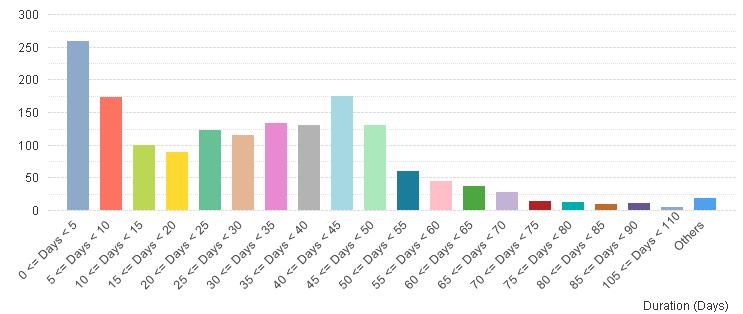
I need to create a similar chart like the one attached.
The issue I have is displaying a vertical line which indicates the average duration value.
I found in the forums tips about using a reference line. But the issue is that it is horizontal.
Your help is highly appreciated.
Thanks!
- Tags:
- new_to_qlikview
Accepted Solutions
- Mark as New
- Bookmark
- Subscribe
- Mute
- Subscribe to RSS Feed
- Permalink
- Report Inappropriate Content
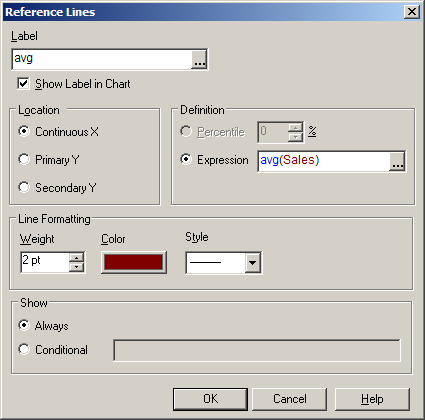
If you have continuous X axis you can add a vertical reference line by choosing Continous X as location:
talk is cheap, supply exceeds demand
- Mark as New
- Bookmark
- Subscribe
- Mute
- Subscribe to RSS Feed
- Permalink
- Report Inappropriate Content
Is this what u need: http://community.qlik.com/thread/45463 ?
- Mark as New
- Bookmark
- Subscribe
- Mute
- Subscribe to RSS Feed
- Permalink
- Report Inappropriate Content
The x-axis needs to be continuous to make it possible to add a vertical reference line. See attached example.
talk is cheap, supply exceeds demand
- Mark as New
- Bookmark
- Subscribe
- Mute
- Subscribe to RSS Feed
- Permalink
- Report Inappropriate Content
Hi,
I can't open your file, because I have a personal edition.
But after definining the Continuous, it's still didn't help.
BTW, I'm using Class for the dimension, but it was overriden by the Continuos.
Thanks!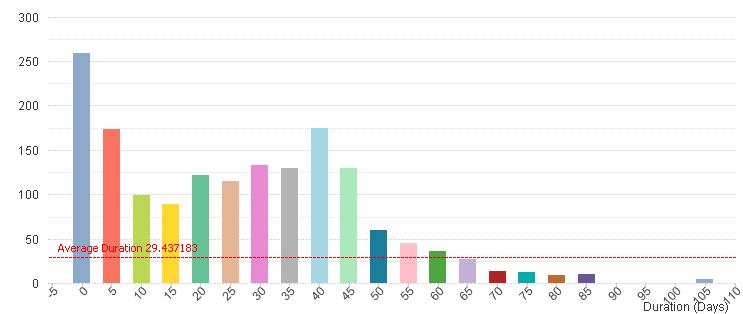
- Mark as New
- Bookmark
- Subscribe
- Mute
- Subscribe to RSS Feed
- Permalink
- Report Inappropriate Content
If you have continuous X axis you can add a vertical reference line by choosing Continous X as location:
talk is cheap, supply exceeds demand
- Mark as New
- Bookmark
- Subscribe
- Mute
- Subscribe to RSS Feed
- Permalink
- Report Inappropriate Content
Now I got it! Thanks!
The only issue left is that I can't use the class display range.
(If I disselect the Continuous from the Axes tab).
Is there a workaround to have both?