Unlock a world of possibilities! Login now and discover the exclusive benefits awaiting you.
- Qlik Community
- :
- All Forums
- :
- QlikView App Dev
- :
- Re: Calendar_Date in X axis representation Q<Numbe...
- Subscribe to RSS Feed
- Mark Topic as New
- Mark Topic as Read
- Float this Topic for Current User
- Bookmark
- Subscribe
- Mute
- Printer Friendly Page
- Mark as New
- Bookmark
- Subscribe
- Mute
- Subscribe to RSS Feed
- Permalink
- Report Inappropriate Content
Calendar_Date in X axis representation Q<Number> and Year
Hi All,
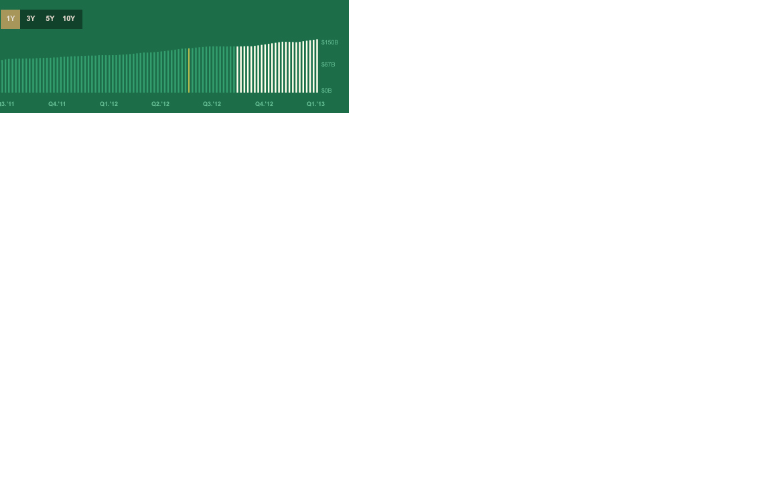
We have requirement to display a Bar chart with sales on Y axis and week in the X axis (Each Bar represents a week). X axis text as Quarter<Number> and year see image below.Pleaes help me to find the exact configurations we need to use to proceed on.
Data Model:
Calendar_Date
Sales
QVW: Attached
Visualization:
- Mark as New
- Bookmark
- Subscribe
- Mute
- Subscribe to RSS Feed
- Permalink
- Report Inappropriate Content
It's possible to use the Dual() function for your dimension but the problem you run into is with sizing. Here is an example of what I mean. Maybe one of the guys on here will have a better solution for you.
- Mark as New
- Bookmark
- Subscribe
- Mute
- Subscribe to RSS Feed
- Permalink
- Report Inappropriate Content
here you can find the working Quarter script.
- Mark as New
- Bookmark
- Subscribe
- Mute
- Subscribe to RSS Feed
- Permalink
- Report Inappropriate Content
Since I have granualr level data (Daily date) Is there any configuration in my Axis setting to group them what ever is the way I want?.
- Mark as New
- Bookmark
- Subscribe
- Mute
- Subscribe to RSS Feed
- Permalink
- Report Inappropriate Content
Since I have granualr level data (Daily date) Is there any configuration in my Axis setting to group them what ever is the way I want?.
- Mark as New
- Bookmark
- Subscribe
- Mute
- Subscribe to RSS Feed
- Permalink
- Report Inappropriate Content
could you elaborate further ?
i see you are doing a simple sum(), to see by date might be quite heavy, you can convert those date to month_year ?
- Mark as New
- Bookmark
- Subscribe
- Mute
- Subscribe to RSS Feed
- Permalink
- Report Inappropriate Content
Dimension is not always same month_year it is depending on the selected Year textbox(1YR/3YR/5YR/10YR).
X- Axis value are
a. 1YR – Daily
b. 3 YR- Monthly
c. 5YR-Quarterly
d. 10YR-Quarterly
We always have daily data and my ask is that can we change these groups dynamically in Axis tab?.
Thanks
Dasu.G
- Mark as New
- Bookmark
- Subscribe
- Mute
- Subscribe to RSS Feed
- Permalink
- Report Inappropriate Content
you can probably try ...
if(GetFieldSelections(yeartextbox)= '1 YR', expression,
if GetFieldSelections(yeartextbox)= '3 YR', ..... )