Unlock a world of possibilities! Login now and discover the exclusive benefits awaiting you.
- Qlik Community
- :
- All Forums
- :
- QlikView App Dev
- :
- Re: Show Last value for a Cumulative Line
- Subscribe to RSS Feed
- Mark Topic as New
- Mark Topic as Read
- Float this Topic for Current User
- Bookmark
- Subscribe
- Mute
- Printer Friendly Page
- Mark as New
- Bookmark
- Subscribe
- Mute
- Subscribe to RSS Feed
- Permalink
- Report Inappropriate Content
Show Last value for a Cumulative Line
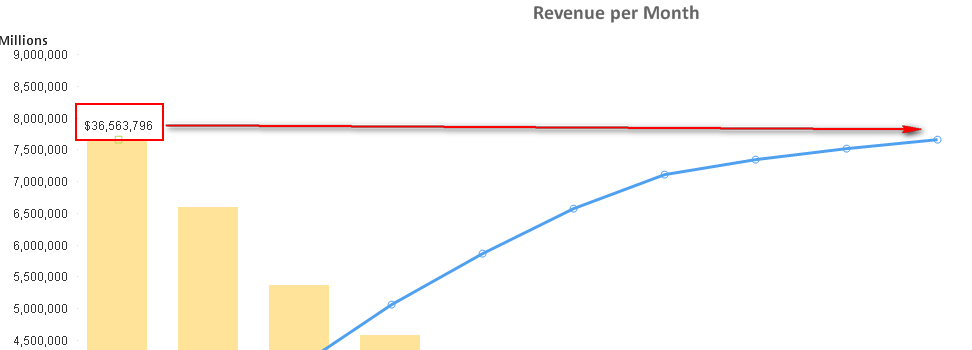
I have a Chart where I want to showthe total cumulative value once its reached at the the end.
I was able to Show Max / Min values for the Bars but NOT the Cumulative. Any assistance would be great.
The formula I used is this: the first part is to get Rank of 1 test if when it = Summation then output Total value.
If(Rank(RangeSum(above(Sum( RevAmt),0,RowNo()))) = 1 , Sum({1} TOTAL RevAmt) )
I then use the Show Value option like this.
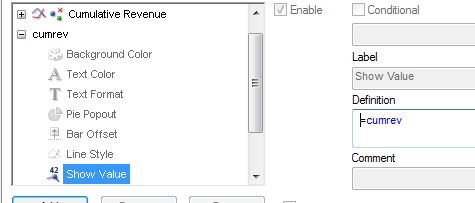
See attahced.
Accepted Solutions
- Mark as New
- Bookmark
- Subscribe
- Mute
- Subscribe to RSS Feed
- Permalink
- Report Inappropriate Content
- Mark as New
- Bookmark
- Subscribe
- Mute
- Subscribe to RSS Feed
- Permalink
- Report Inappropriate Content
You want to show the value of the expression for the last value of the x-axis dimension. Can't you use max to test for that? if(max([Rev Months])=[Rev Months],1,0)
talk is cheap, supply exceeds demand
- Mark as New
- Bookmark
- Subscribe
- Mute
- Subscribe to RSS Feed
- Permalink
- Report Inappropriate Content
No luck. Tried this. if(max(RevMonth)=RevMonth, Sum({1} TOTAL RevAmt),0)
Seems simple but proving not to be for Cumulative.
I can draw a Cumulative line using this: RangeSum(above(Sum( RevAmt),0,RowNo()))
So I figured I would use that to Compare against my total value which outputs the correct total. Instead it outputs for every plot point.
- Mark as New
- Bookmark
- Subscribe
- Mute
- Subscribe to RSS Feed
- Permalink
- Report Inappropriate Content
I was able to get this expression to show but plots incorrectly.
If(Sum( RevAmt) = RangeSum(above(Sum(RevAmt),0,RowNo())) , Sum( TOTAL RevAmt) )
- Mark as New
- Bookmark
- Subscribe
- Mute
- Subscribe to RSS Feed
- Permalink
- Report Inappropriate Content
See attached example
talk is cheap, supply exceeds demand
- Mark as New
- Bookmark
- Subscribe
- Mute
- Subscribe to RSS Feed
- Permalink
- Report Inappropriate Content
Nice, I see what you meant before but more so. Instead use the Text vs Show Value. Thanks.