Unlock a world of possibilities! Login now and discover the exclusive benefits awaiting you.
- Qlik Community
- :
- All Forums
- :
- QlikView App Dev
- :
- Re: "Others" block appears in block chart
- Subscribe to RSS Feed
- Mark Topic as New
- Mark Topic as Read
- Float this Topic for Current User
- Bookmark
- Subscribe
- Mute
- Printer Friendly Page
- Mark as New
- Bookmark
- Subscribe
- Mute
- Subscribe to RSS Feed
- Permalink
- Report Inappropriate Content
"Others" block appears in block chart
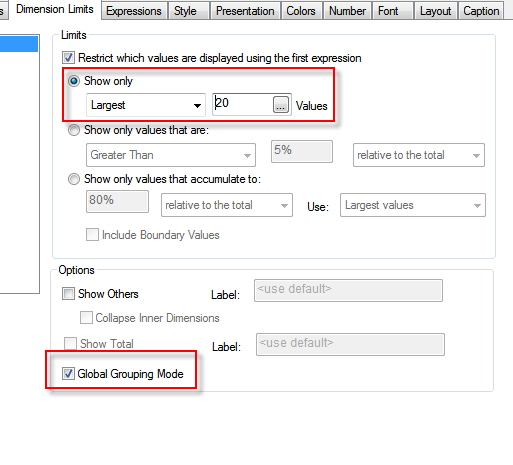
In QlikView 11, I've created a block chart to show the top n clients, where n is set dynamically based on a variable set by the user. In Dimension Limits, I have "Restrict which values are displayed using the first expression" checked and the first radio button (to show only largest n values) selected. The "Show Others" and "Global Grouping Mode" checkboxes are not checked.
For the most part this works fine. The problem is that sometimes (with no obvious pattern) an "Others" box is included in the graph. Why? And, if I check the "Show Others" option in Dimension Limits, I get two Others boxes. Any ideas as to why this is happening or how I can prevent an "Others" box from being included?
Thanks.
- Mark as New
- Bookmark
- Subscribe
- Mute
- Subscribe to RSS Feed
- Permalink
- Report Inappropriate Content
You can put the application in order to check?
- Mark as New
- Bookmark
- Subscribe
- Mute
- Subscribe to RSS Feed
- Permalink
- Report Inappropriate Content
Hi Rebeca,
Unforunately, I can't share the application as it contains sensitive information. Let me know if there are any specific pieces of information I can provide to help shed some light on this issue.
- Mark as New
- Bookmark
- Subscribe
- Mute
- Subscribe to RSS Feed
- Permalink
- Report Inappropriate Content
based on the fact that you are using global grouping mode, I assume you are using multiple dimensions. have you checked "show others" for all of the dimensions? this may not be obvious first, but you can set "show others" for each dimension separately by highlighting the appropriate dimension checking/unchecking the tickbox.
- Mark as New
- Bookmark
- Subscribe
- Mute
- Subscribe to RSS Feed
- Permalink
- Report Inappropriate Content
Hi Istvan,
I am not using global grouping mode, and I only have one dimension. The problem is that I don't want to show others and yet the "Others" box is sporatically appearing in my chart (even though the "Show Others" option is turned off).
- Mark as New
- Bookmark
- Subscribe
- Mute
- Subscribe to RSS Feed
- Permalink
- Report Inappropriate Content
...Unforunately, I can't share the application as it contains sensitive information...
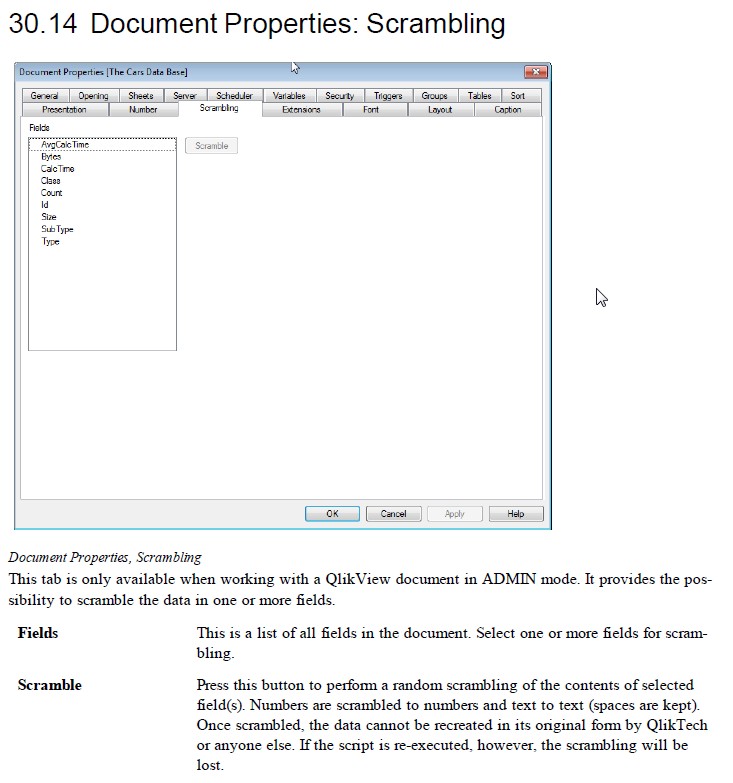
Stephen FYI, you could use Scrambling in order to encode sensitive data. See Reference Manual ...
Regards,
Florian
- Mark as New
- Bookmark
- Subscribe
- Mute
- Subscribe to RSS Feed
- Permalink
- Report Inappropriate Content
I think it is because the sum of your others is large enough to fit inside the chart and they are the same. The following simple code causes it to happen:
Load
* Inline
[Value, Code
11, a
22, b1
22, b2
22, b3
22, b4
22, b5
22, b6
22, b7
22, b8
22, b9
22, b10
22, b
4000, c
5000, d
6000, e
]
;
Then create a chart with top 8 defined - Hope this helps
- Mark as New
- Bookmark
- Subscribe
- Mute
- Subscribe to RSS Feed
- Permalink
- Report Inappropriate Content
Hi rupe,
Yes. This is exactly the problem. The top values in my graph are as follows:
27
15
14
14
14
12
11
10
9
9
7
6
6
4
3
2
2
2
1
1
1
1
1
When I set Dimension Limits to show only the top 21, I see the top 19 and then an "Other" box. My extra carriage return above shows where the top 21 ends. The other box that appears in my graph has the value of 2, which is misleading because the sum total of all others (not just the others in the top 21) is five. Why aren't values #20 and #21 listed separately? Usually (if I change the Dimension Limits to show the top 15 values, for example), the graph renders as I expect, with no Others box.
Is there a way to turn off this behavior?
Thanks,
Stephen
- Mark as New
- Bookmark
- Subscribe
- Mute
- Subscribe to RSS Feed
- Permalink
- Report Inappropriate Content
I think the issue with Block Charts is that it doesn't not do a good job a mimicking the expected behavior of a Treemap and frankly it's frustrating when you are trying to create a block charts with high count of dimension value as the QV's default "QV" has bugs.
I've been testing to see what is the cutoff for the # of blocks before it defaults the smallest block value to "Other" categorizing and believe it's around a count of 76. So
@stephenk, the best way to exclude the "Others" from the chart is to set the Block chart to always show only "N" (i.e 20) amount* of values via the Dimension Limits. For this to work "Global Grouping Mode" has to be set.
*Up to 76, if you try to show top 77 or whatever the cutoff is, it will show "Other" bucket regardless whether or not you want the other buck to show.