Unlock a world of possibilities! Login now and discover the exclusive benefits awaiting you.
- Qlik Community
- :
- All Forums
- :
- QlikView App Dev
- :
- Re: Linear Guage Question
- Subscribe to RSS Feed
- Mark Topic as New
- Mark Topic as Read
- Float this Topic for Current User
- Bookmark
- Subscribe
- Mute
- Printer Friendly Page
- Mark as New
- Bookmark
- Subscribe
- Mute
- Subscribe to RSS Feed
- Permalink
- Report Inappropriate Content
Linear Guage Question
Hi Folks
I'm trying to create a linear guage where the guage is filled to value but also includes a colour segment after the fill to value, much the same as this image:
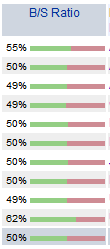
I had assumed that this would require setting the lower limit of segment 2 to be variable, so that the lower limit is actually the value of the column itself. However, when I try to addin either Column(4) or the actual expression Sum(a)/(Sum(a)+Sum(b)) into the lower segment it doesn't work.
If I use Column(4) then the lowe limit is set to zero and I get a solid red bar,
If I use the expression then it works but it sets the lower limit the same on every linear chart in the table, so it would appear that it is executing this calculation over the total dataset, not the row in the table.
Any ideas?
Nigel.
Accepted Solutions
- Mark as New
- Bookmark
- Subscribe
- Mute
- Subscribe to RSS Feed
- Permalink
- Report Inappropriate Content
You can try setting the background color of the gauge to red. I've used something similar here in combination with a white fill color to create a 'negative' valued bar.
talk is cheap, supply exceeds demand
- Mark as New
- Bookmark
- Subscribe
- Mute
- Subscribe to RSS Feed
- Permalink
- Report Inappropriate Content
Hi Gysbert
Not perfect, but good enough to get me out of trouble.
Thanks for your help.
Nigel.