Unlock a world of possibilities! Login now and discover the exclusive benefits awaiting you.
- Qlik Community
- :
- All Forums
- :
- QlikView App Dev
- :
- Problem with set analysis in table
- Subscribe to RSS Feed
- Mark Topic as New
- Mark Topic as Read
- Float this Topic for Current User
- Bookmark
- Subscribe
- Mute
- Printer Friendly Page
- Mark as New
- Bookmark
- Subscribe
- Mute
- Subscribe to RSS Feed
- Permalink
- Report Inappropriate Content
Problem with set analysis in table
Hello,
I have a problem with a column in wich I am using set analysis. I attached an example with my problem.
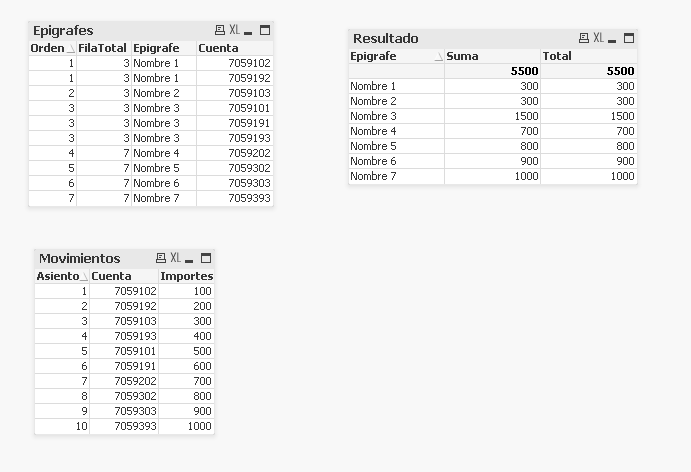
I have two tables, "Epigrafes" and "Movimientos". Both are related by the column Cuenta.
What I need is to modify the expression of column "Total" in the table "Resultado" to display the sum of the amounts ("Importes") for column related FilaTotal.
Example:
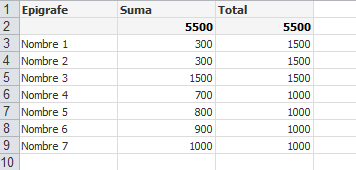
This is what I need. Rows 3, 4 and 5 have to show the sum of row 5. And 6, 7, 8 and 9 rows the sum of row 9.
I've tried with the expression: =SUM({$<Epigrafe=,Orden={'=FilaTotal'}>}Importes)
but it doesn't works.
Can you help me?
Best regards,
Oscar Iglesias.
Accepted Solutions
- Mark as New
- Bookmark
- Subscribe
- Mute
- Subscribe to RSS Feed
- Permalink
- Report Inappropriate Content
Hello,
Please try with this expression
=sum( total <FilaTotal> match(FilaTotal,Orden)*Importes)
you have to add in your chart the dimension FilaTotal, but you can hide the column if it is a problem
Regards,
Benoît
- Mark as New
- Bookmark
- Subscribe
- Mute
- Subscribe to RSS Feed
- Permalink
- Report Inappropriate Content
This solution is not valid, to use the "max" does not always return the correct value. If the amount change sign as deputy qvw that no longer works.
Some solution.
- Mark as New
- Bookmark
- Subscribe
- Mute
- Subscribe to RSS Feed
- Permalink
- Report Inappropriate Content
Hello,
Please try with this expression
=sum( total <FilaTotal> match(FilaTotal,Orden)*Importes)
you have to add in your chart the dimension FilaTotal, but you can hide the column if it is a problem
Regards,
Benoît
- Mark as New
- Bookmark
- Subscribe
- Mute
- Subscribe to RSS Feed
- Permalink
- Report Inappropriate Content
Thank you very much for your answer, it works.
Regards,
Oscar Iglesias.