Unlock a world of possibilities! Login now and discover the exclusive benefits awaiting you.
- Qlik Community
- :
- All Forums
- :
- QlikView App Dev
- :
- Straight table - sum total not working
- Subscribe to RSS Feed
- Mark Topic as New
- Mark Topic as Read
- Float this Topic for Current User
- Bookmark
- Subscribe
- Mute
- Printer Friendly Page
- Mark as New
- Bookmark
- Subscribe
- Mute
- Subscribe to RSS Feed
- Permalink
- Report Inappropriate Content
Straight table - sum total not working
Hi,
I'm really hoping someone can help me. I cannot attach the file I'm using so hopefully the details are clear enough below - I'm so confused!!!
Within a table I have the following data:
Client Bill Date Amount
xxx 30/11/10 10,924
xxx 22/06/10 15.650
the Amount column works of the following expression:
sum({$<[BILLINGS Bill Date]={">=$(cddate1)<=$(cddate2)"},CUR={$(=vSelCur)}>}[BILLINGS FeesBilled Amt])
*
sum({$<[BILLINGS Bill Date]={">=$(cddate1)<=$(cddate2)"},CUR={$(=vSelCur)}>}cdrate)
which shows me a total of 26.574
However if I remove the bill date from the above table, I get a total of 53,054! (using the same expression as above).
Client Amount
xxx 10,924
I've looked on the website, and I suspect I need to use the aggr function within my expression, but I'm most probably wrong, why is the total not summing correctly and how can I get it to work?
Thanks.
Dave.
- « Previous Replies
-
- 1
- 2
- Next Replies »
Accepted Solutions
- Mark as New
- Bookmark
- Subscribe
- Mute
- Subscribe to RSS Feed
- Permalink
- Report Inappropriate Content
Hi David.
since you are using interval match, there is no need to use set analysis for the limits. The only problem would be if you have overlapping dates in your rates table for example :
01/11/2010 15/11/2010 EUR 1.14
01/11/2010 30/11/2010 EUR 1.28
In this case, for billing date 10/11/2010, what is the corrrect rate? 1.14 or 1.28? I used max in my attached example.
Please check out the attached, but note :
1. I changed the variable expression
2. max is used for overlapping intervals
3. you need to get rid of the sync table
BR, Ioannis.
- Mark as New
- Bookmark
- Subscribe
- Mute
- Subscribe to RSS Feed
- Permalink
- Report Inappropriate Content
I presume you remove the field bill date from the chart? Then yes, you have to aggr :
Aggr(
<your expression>
, Client, [Bill Date])
if this returns more than one value, you need to sum too :
sum(Aggr(
<your expression>
, Client, [Bill Date]))
- Mark as New
- Bookmark
- Subscribe
- Mute
- Subscribe to RSS Feed
- Permalink
- Report Inappropriate Content
Sorry the second chart should show the total of both bill dates - so 53,054.
I've tried adding the below formula but it does not show anything.
aggr(sum({$<[BILLINGS Bill Date]={">=$(cddate1)<=$(cddate2)"},CUR={$(=vSelCur)}>}[BILLINGS FeesBilled Amt])
*
(sum({$<[BILLINGS Bill Date]={">=$(cddate1)<=$(cddate2)"},CUR={$(=vSelCur)}>}[cdrate]))
- Mark as New
- Bookmark
- Subscribe
- Mute
- Subscribe to RSS Feed
- Permalink
- Report Inappropriate Content
aggr(
sum({$<[BILLINGS Bill Date]={">=$(cddate1)<=$(cddate2)"},CUR={$(=vSelCur)}>}[BILLINGS FeesBilled Amt])
*
sum({$<[BILLINGS Bill Date]={">=$(cddate1)<=$(cddate2)"},CUR={$(=vSelCur)}>}cdrate)
, Client, [Bill Date])
but I am not sure what you mean by "Sorry the second chart should show the total of both bill dates - so 53,054."
- Mark as New
- Bookmark
- Subscribe
- Mute
- Subscribe to RSS Feed
- Permalink
- Report Inappropriate Content
What I mean is that the chart should only show the client name and the amount only.
I've added your formula to my table, but it still does not bring any value back:
aggr(
sum({$<[BILLINGS Bill Date]={">=$(cddate1)<=$(cddate2)"},CUR={$(=vSelCur)}>}[BILLINGS FeesBilled Amt])
*
sum({$<[BILLINGS Bill Date]={">=$(cddate1)<=$(cddate2)"},CUR={$(=vSelCur)}>}cdrate)
, [Client Name], [BILLINGS Bill Date]
- Mark as New
- Bookmark
- Subscribe
- Mute
- Subscribe to RSS Feed
- Permalink
- Report Inappropriate Content
sample application would help if you cannot post the original
- Mark as New
- Bookmark
- Subscribe
- Mute
- Subscribe to RSS Feed
- Permalink
- Report Inappropriate Content
I've mocked up an example of the application I'm using, note that the figures are in GBP, when you click on the table holding client, amount the figures should multiply by the rate in the image, so for HKD instead of showing 3,306 it shows 37,120.80! this is the problem I have my formula is not calculating correctly.
- Mark as New
- Bookmark
- Subscribe
- Mute
- Subscribe to RSS Feed
- Permalink
- Report Inappropriate Content
I have tried to hide these columns in my table but that doesn't seem to work as I get 2 lines still for the client, I have tried what Loannis has suggested as well but the formula always comes back as displaying nothing.
- Mark as New
- Bookmark
- Subscribe
- Mute
- Subscribe to RSS Feed
- Permalink
- Report Inappropriate Content
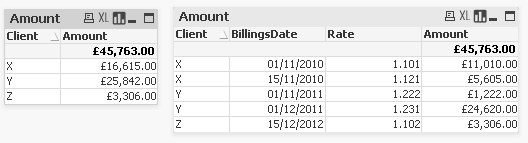
is this the result you need ?
- « Previous Replies
-
- 1
- 2
- Next Replies »