Unlock a world of possibilities! Login now and discover the exclusive benefits awaiting you.
- Qlik Community
- :
- All Forums
- :
- QlikView App Dev
- :
- USING AGGR in chart
- Subscribe to RSS Feed
- Mark Topic as New
- Mark Topic as Read
- Float this Topic for Current User
- Bookmark
- Subscribe
- Mute
- Printer Friendly Page
- Mark as New
- Bookmark
- Subscribe
- Mute
- Subscribe to RSS Feed
- Permalink
- Report Inappropriate Content
USING AGGR in chart

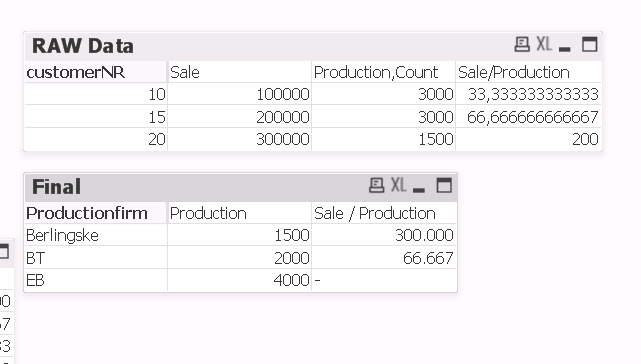
I have Sales pr.customer and
Production pr.customer and manufactorer.
Im trying to use the aggr function. But when to productionmanufactors have to split Sales on customer, one of the manufactors get NULL.
In the third column i cant understand why manufactor EB dont get any Sale from customer 10.
I have sent a Qlikview document with.
In my qlikview document i want to show the Sales pr.Manufactorer based on their production pr.customer.
Hope you can help
Hermann 🙂
- Mark as New
- Bookmark
- Subscribe
- Mute
- Subscribe to RSS Feed
- Permalink
- Report Inappropriate Content
Hi,
Check your data table.. you dont have Revenue for kilde: EB and CustomerNR:10
That's why it is returning null value.. other wise your expression is ok..
HTH
Sushil
- Mark as New
- Bookmark
- Subscribe
- Mute
- Subscribe to RSS Feed
- Permalink
- Report Inappropriate Content
Hi,
Exactly i don't know what you want.
use below mentioned syntex:
Ex: =aggr(NODISTINCT Sum(Revenue),customerNR)/aggr(NODISTINCT Sum(Count),customerNR,Kilde)
Else
explain Briefly
- Mark as New
- Bookmark
- Subscribe
- Mute
- Subscribe to RSS Feed
- Permalink
- Report Inappropriate Content
Hi Sushil.
Thank you for youre answer.
I only have revenue for customers. I want to let the production get their share of the revenue.
I want the "kilde" share of the revenue.
Customer 10 100.000
Production on customer 10 , EB 50 and BT 50, then i want to show 50.000 on EB and 50.000 on BT.
- Mark as New
- Bookmark
- Subscribe
- Mute
- Subscribe to RSS Feed
- Permalink
- Report Inappropriate Content
Hi Kumar
Thank you for youre response.
Customer 10 has 100.000 in revenue.
Manufactor EB produces 1.000 and BT produces 2.000 to customer 10.
I want qlikview to show for EB ((100.000/3000)*1000 =33.333 and for BT ((100.000/3000)*2000 =66.667
In the 3.table TO THE RIGHT Qlikview only shows BT and they get all revenue, EB gets NUll. FOR CUSTOMER 10.
I want to show Production share of the revenue by manufactor.
Hope it helps to understand.
- Mark as New
- Bookmark
- Subscribe
- Mute
- Subscribe to RSS Feed
- Permalink
- Report Inappropriate Content
I have used Nodistinct. BT is correct now, but EB needs its revenue share from customer 10 and 15.
=(
aggr(NODISTINCT Sum( Revenue),customerNR)/aggr(NODISTINCT Sum(Count),customerNR))
*Sum(Count)
- Mark as New
- Bookmark
- Subscribe
- Mute
- Subscribe to RSS Feed
- Permalink
- Report Inappropriate Content
hi the problem you have is due to your data structere
the simple solution is to have to seperate tables
one for production and one for sales
have a look at the attach document
- Mark as New
- Bookmark
- Subscribe
- Mute
- Subscribe to RSS Feed
- Permalink
- Report Inappropriate Content
Hi Liron.
Thank you for youre answer my problem is that my original document contains 2 GB of data
So splitting into to tables is a little complicated. (there are a lot more fields that use in other circumstances. )
I want a chart where the only dimension is "Kilde" and then the "kilde" share of the customers revenue based on their production to the customer.
As you can see in reply under this replay. (I only want to use dimension "kilde" in chart. )
Berlingske 300.000 (Revenue, from customer 20)
BT 66.667 (2/3 revenue from customer 10)
EB (33.333+200.000) (1/3 revenue from customer 10 + revenue from customer 15)