Unlock a world of possibilities! Login now and discover the exclusive benefits awaiting you.
- Qlik Community
- :
- All Forums
- :
- QlikView App Dev
- :
- Re: Need a accumulative in pivot table by line
Options
- Subscribe to RSS Feed
- Mark Topic as New
- Mark Topic as Read
- Float this Topic for Current User
- Bookmark
- Subscribe
- Mute
- Printer Friendly Page
Turn on suggestions
Auto-suggest helps you quickly narrow down your search results by suggesting possible matches as you type.
Showing results for
Not applicable
2013-05-16
11:28 AM
- Mark as New
- Bookmark
- Subscribe
- Mute
- Subscribe to RSS Feed
- Permalink
- Report Inappropriate Content
Need a accumulative in pivot table by line
I need design a chart with year and month as dimension accumulating sales in last column.
Looks like:
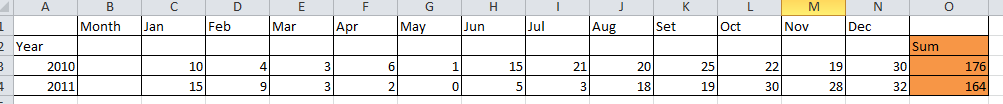
Remember, sum need be only the last column.
How can i do this?
Thks for advice!
277 Views
3 Replies
2013-05-16
11:47 AM
- Mark as New
- Bookmark
- Subscribe
- Mute
- Subscribe to RSS Feed
- Permalink
- Report Inappropriate Content
On the Presentation tab select the Month dimension enable Show Partial Sums for that dimension.
talk is cheap, supply exceeds demand
Luminary Alumni
2013-05-16
11:48 AM
- Mark as New
- Bookmark
- Subscribe
- Mute
- Subscribe to RSS Feed
- Permalink
- Report Inappropriate Content
Please check app attached.
Not applicable
2013-05-16
12:14 PM
Author
- Mark as New
- Bookmark
- Subscribe
- Mute
- Subscribe to RSS Feed
- Permalink
- Report Inappropriate Content
Nice!
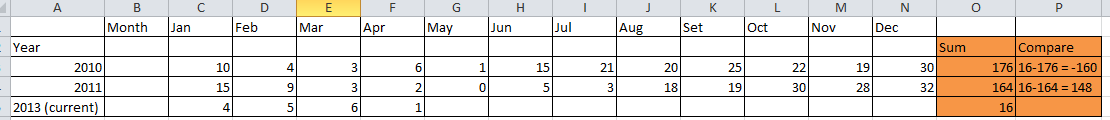
Now, how can i get this value and compare with sum(sales) from current year?
166 Views