Unlock a world of possibilities! Login now and discover the exclusive benefits awaiting you.
- Qlik Community
- :
- All Forums
- :
- QlikView App Dev
- :
- Re: Set Analysis and Count Distinct Expression
- Subscribe to RSS Feed
- Mark Topic as New
- Mark Topic as Read
- Float this Topic for Current User
- Bookmark
- Subscribe
- Mute
- Printer Friendly Page
- Mark as New
- Bookmark
- Subscribe
- Mute
- Subscribe to RSS Feed
- Permalink
- Report Inappropriate Content
Set Analysis and Count Distinct Expression
In the attached pivot I would like to create a expression that counts by grade employees present in both time periods and with the same grade in both periods.
For grade B the correct answer should be 2.
- « Previous Replies
-
- 1
- 2
- Next Replies »
Accepted Solutions
- Mark as New
- Bookmark
- Subscribe
- Mute
- Subscribe to RSS Feed
- Permalink
- Report Inappropriate Content
Maybe something like this?
=count( distinct aggr( if( count({<Year = {">=$(FromPeriod)<=$(To)"}>}distinct Year) = 2, EmpID),EmpID,Grade))
- Mark as New
- Bookmark
- Subscribe
- Mute
- Subscribe to RSS Feed
- Permalink
- Report Inappropriate Content
So do you need to see 2009 in one column and 2010 in another
- Mark as New
- Bookmark
- Subscribe
- Mute
- Subscribe to RSS Feed
- Permalink
- Report Inappropriate Content
You can try this for 2009

And then this for 2010

- Mark as New
- Bookmark
- Subscribe
- Mute
- Subscribe to RSS Feed
- Permalink
- Report Inappropriate Content
No I would like to see one column that counts distinct empID's with same grade in both time periods.And I want to add the grade dimension to it.
So right now for grade B it is counting EMP ID 1,2 and 3 when it should be counting only EmpID 1 and 3 that fits the above criteria.
Thanks for your help
- Mark as New
- Bookmark
- Subscribe
- Mute
- Subscribe to RSS Feed
- Permalink
- Report Inappropriate Content
The condition I want to apply in the expression is employees present in both time periods and employees with same grade in both time periods.
- Mark as New
- Bookmark
- Subscribe
- Mute
- Subscribe to RSS Feed
- Permalink
- Report Inappropriate Content
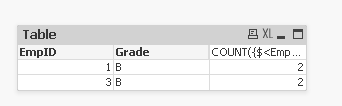
Like this 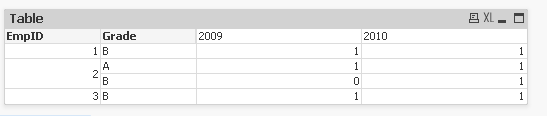
- Mark as New
- Bookmark
- Subscribe
- Mute
- Subscribe to RSS Feed
- Permalink
- Report Inappropriate Content
Yes so in my pivot I want to create an expression that counts only EmpID 1 and 3 and excludes EmpID 2 when the dimension is Grade - B
Thanks again
- Mark as New
- Bookmark
- Subscribe
- Mute
- Subscribe to RSS Feed
- Permalink
- Report Inappropriate Content
Set analysis is evaluated once per chart, not per dimenion line, so considering the dimension value of Grade in your set expression is not feasible.
You can try something like
=count(distinct aggr( if( count(distinct Year) = 2, EmpID),EmpID,Grade))
- Mark as New
- Bookmark
- Subscribe
- Mute
- Subscribe to RSS Feed
- Permalink
- Report Inappropriate Content
Thank you Swuehl, however my data model runs into multiple years and I would like to include the input variables in the expression and try calculating the same expression for different time period selection from the front end.
Thanks again for your help.
- Mark as New
- Bookmark
- Subscribe
- Mute
- Subscribe to RSS Feed
- Permalink
- Report Inappropriate Content
Sorry, I am not a pro, do you need it like this
If so, I used the following

- « Previous Replies
-
- 1
- 2
- Next Replies »