Unlock a world of possibilities! Login now and discover the exclusive benefits awaiting you.
- Qlik Community
- :
- All Forums
- :
- QlikView App Dev
- :
- Re: Cross Table Solution required
- Subscribe to RSS Feed
- Mark Topic as New
- Mark Topic as Read
- Float this Topic for Current User
- Bookmark
- Subscribe
- Mute
- Printer Friendly Page
- Mark as New
- Bookmark
- Subscribe
- Mute
- Subscribe to RSS Feed
- Permalink
- Report Inappropriate Content
Cross Table Solution required
Hey,
I've got a problem regarding cross table.
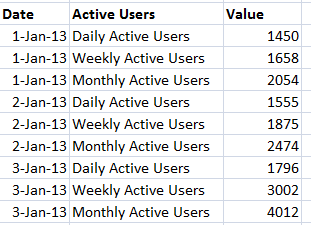
I am getting data as shown in the following image:
But I want to display the data like this:
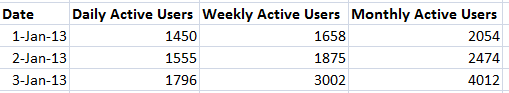
Daily active users, Monthly active users and Weekly active Users should be displayed in a row and there corresponding values should be displayed below them.
Help me out.
Regards,
Hannan Tariq
Accepted Solutions
- Mark as New
- Bookmark
- Subscribe
- Mute
- Subscribe to RSS Feed
- Permalink
- Report Inappropriate Content
Hi Hannan,
Use this load script
[Data]:
LOAD * Inline [
Dates, Active Users, Value
01-01-2013, Daily Active Users, 1450
01-01-2013, Weekly Acive Users, 1658
01-01-2013, Monthly Active Users, 2054
02-01-2013, Daily Active Users, 1555
02-01-2013, Weekly Acive Users, 1875
02-01-2013, Monthly Active Users, 2474
03-01-2013, Daily Active Users, 1796
03-01-2013, Weekly Acive Users, 3002
03-01-2013, Monthly Active Users, 4012];
[TMP1]:
GENERIC LOAD * RESIDENT [Data];
[RESULT]:
LOAD DISTINCT Dates RESIDENT [Data];
DROP TABLE [Data];
FOR i = 0 to NoOfTables()
TableList:
LOAD '[' & TableName($(i)) &']' AS Tablename AUTOGENERATE 1
WHERE WildMatch(TableName($(i)), 'TMP1.*');
NEXT i
FOR i = 1 to FieldValueCount('Tablename')
LET vTable = FieldValue('Tablename', $(i));
LEFT JOIN ([RESULT]) LOAD * RESIDENT $(vTable);
DROP TABLE $(vTable);
NEXT i
DROP Table TableList;
See sample attached file also.
Regards,
Sokkorn
- Mark as New
- Bookmark
- Subscribe
- Mute
- Subscribe to RSS Feed
- Permalink
- Report Inappropriate Content
Create a pivot table chart with Date and Active Users as dimensions and sum(Value) as expression. Then pivot the Active Users dimension to horizontal position by dragging its header to the right above the expression. When you see a horizontal blue line you can drop it and it should be in place.
talk is cheap, supply exceeds demand
- Mark as New
- Bookmark
- Subscribe
- Mute
- Subscribe to RSS Feed
- Permalink
- Report Inappropriate Content
Hi Hannan,
Use this load script
[Data]:
LOAD * Inline [
Dates, Active Users, Value
01-01-2013, Daily Active Users, 1450
01-01-2013, Weekly Acive Users, 1658
01-01-2013, Monthly Active Users, 2054
02-01-2013, Daily Active Users, 1555
02-01-2013, Weekly Acive Users, 1875
02-01-2013, Monthly Active Users, 2474
03-01-2013, Daily Active Users, 1796
03-01-2013, Weekly Acive Users, 3002
03-01-2013, Monthly Active Users, 4012];
[TMP1]:
GENERIC LOAD * RESIDENT [Data];
[RESULT]:
LOAD DISTINCT Dates RESIDENT [Data];
DROP TABLE [Data];
FOR i = 0 to NoOfTables()
TableList:
LOAD '[' & TableName($(i)) &']' AS Tablename AUTOGENERATE 1
WHERE WildMatch(TableName($(i)), 'TMP1.*');
NEXT i
FOR i = 1 to FieldValueCount('Tablename')
LET vTable = FieldValue('Tablename', $(i));
LEFT JOIN ([RESULT]) LOAD * RESIDENT $(vTable);
DROP TABLE $(vTable);
NEXT i
DROP Table TableList;
See sample attached file also.
Regards,
Sokkorn
- Mark as New
- Bookmark
- Subscribe
- Mute
- Subscribe to RSS Feed
- Permalink
- Report Inappropriate Content
Thank You Gysbert, Your solution is helpful. I am able to accomplish thte task by some more modifications in the script. What I did is in the following script.
LOAD
Active Users,
pacific_date as Date,
Value as day
FROM [Corresponding Source]
where period ='day';
join
LOAD
Active Users,
pacific_date as Date,
Value as week
FROM [Corresponding Source]
where period ='week';
join
LOAD
Active Users,
pacific_date as Date,
Value as month
FROM [Corresponding Source]
where period ='month';
And then added the dimension Date in the Pivot table and sum(day), sum(week), sum(month) in the expressions and then tada.
Thank you for your help.
- Mark as New
- Bookmark
- Subscribe
- Mute
- Subscribe to RSS Feed
- Permalink
- Report Inappropriate Content
Thank you so much Sokkorn Cheav for your help.
I have resolved the problem.