Unlock a world of possibilities! Login now and discover the exclusive benefits awaiting you.
- Qlik Community
- :
- All Forums
- :
- QlikView App Dev
- :
- Re: gauss curve in histogram
- Subscribe to RSS Feed
- Mark Topic as New
- Mark Topic as Read
- Float this Topic for Current User
- Bookmark
- Subscribe
- Mute
- Printer Friendly Page
- Mark as New
- Bookmark
- Subscribe
- Mute
- Subscribe to RSS Feed
- Permalink
- Report Inappropriate Content
gauss curve in histogram
Hello community,
I am quite new experiencing QV.
I have to build a diagram containing a histogram and a bell curve (gauss curve / normal distribution).
For drawing the histogram I am using formula
=count( [DLZ-Tage])
For drawing the bell curve I am using formula
=normdist((ceil(min([DLZ-Tage]))+Floor(Min([DLZ-Tage])))/2,avg({1} total [DLZ-Tage]),stdev({1} total [DLZ-Tage]),0)
[DLZ-Tage] ist the amount of days it takes a single piece of work to be comleted.
My only dimension is
=class([DLZ-Tage], 1)
In my diagram both graphs are shown (see snapshot), but I want the maximum of the bell curve to be drawn at the median (represented by the orange dotted line).
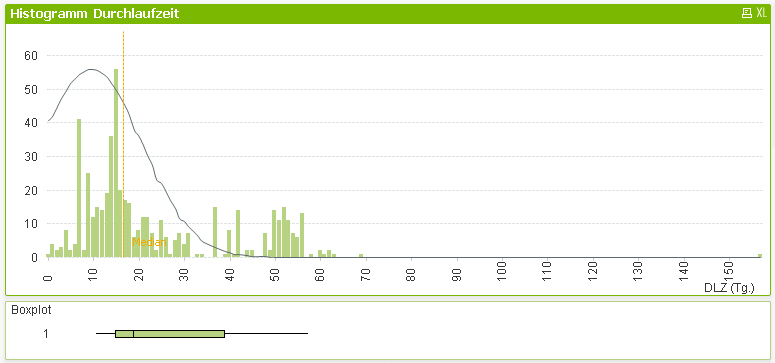
Anybody an idea?
Unfortunately I didn't receive an answer anfter I added the graph. Has anybody an idea that could help me?
Nachricht geändert durch Falko Thom
- Mark as New
- Bookmark
- Subscribe
- Mute
- Subscribe to RSS Feed
- Permalink
- Report Inappropriate Content
I think you failed attaching the document
- Mark as New
- Bookmark
- Subscribe
- Mute
- Subscribe to RSS Feed
- Permalink
- Report Inappropriate Content
Hallo Falko,
try to change your formula appropriate to:
=normdist((ceil(min([DLZ-Tage]))+Floor(Min([DLZ-Tage])))/2, median({1} total [DLZ-Tage]),stdev({1} total [DLZ-Tage]),0)
Regards,
Eddie
- Mark as New
- Bookmark
- Subscribe
- Mute
- Subscribe to RSS Feed
- Permalink
- Report Inappropriate Content
Hi Eddie,
thanks for your answer.
I used the following formula and it worked very well:
=normdist((ceil(min([DLZ-Tage]))+Floor(Min([DLZ-Tage])))/2,Median(total [DLZ-Tage]),stdev(total [DLZ-Tage]),0)
I had to omit the {1} in order to lay the peak of the curve over the median.