Unlock a world of possibilities! Login now and discover the exclusive benefits awaiting you.
- Qlik Community
- :
- All Forums
- :
- QlikView App Dev
- :
- Re: Displaying values in chart without Aggregation
- Subscribe to RSS Feed
- Mark Topic as New
- Mark Topic as Read
- Float this Topic for Current User
- Bookmark
- Subscribe
- Mute
- Printer Friendly Page
- Mark as New
- Bookmark
- Subscribe
- Mute
- Subscribe to RSS Feed
- Permalink
- Report Inappropriate Content
Displaying values in chart without Aggregation
Hello there,
I have a set of data which looks as follows.
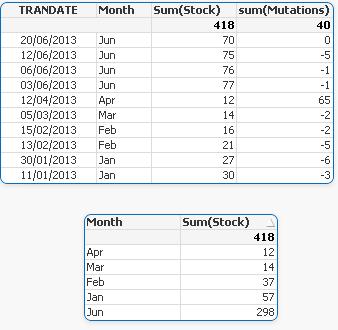
| Date | Stock | Mutations |
| 20-06-2013 | 70 | 0 |
| 12-06-2013 | 75 | -5 |
| 06-06-2013 | 76 | -1 |
| 03-06-2013 | 77 | -1 |
| 12-04-2013 | 12 | 65 |
| 05-03-2013 | 14 | -2 |
| 15-02-2013 | 16 | -2 |
| 13-02-2013 | 21 | -5 |
| 30-01-2013 | 27 | -6 |
| 11-01-2013 | 30 | -3 |
I want to display this data in a chart, for each month.I used 'num(Month(Date)) as Month' to get the month for each record. However, when i use this month as dimension, it only shows the records which have only one record in a month.
I know I should use an aggregation, cause there are more records in that month, but which one can I use to not get wrong data? So let's say only the latest date?
If i use Sum() I will get a not accurate display of data.
Accepted Solutions
- Mark as New
- Bookmark
- Subscribe
- Mute
- Subscribe to RSS Feed
- Permalink
- Report Inappropriate Content
It depends what you want to achieve, if you want to get the latest Stock per Month, you can use FirstSortedValue as expression in your chart:
=FirstSortedValue( Stock, -Date)
assuming you have only one Stock value per Date
- Mark as New
- Bookmark
- Subscribe
- Mute
- Subscribe to RSS Feed
- Permalink
- Report Inappropriate Content
Thank you, it works actually  but what if i have more stock values on a date?
- Mark as New
- Bookmark
- Subscribe
- Mute
- Subscribe to RSS Feed
- Permalink
- Report Inappropriate Content
Do you want to sum the values for that date?
=FirstSortedValue( aggr(sum(Stock),Date), aggr( -Date,Date) )
or do you want the latest Stock value for that date?
Then you could introduce a timestamp / recno (whatever describes your 'latest' on that date) and use that instead of Date in above function.
- Mark as New
- Bookmark
- Subscribe
- Mute
- Subscribe to RSS Feed
- Permalink
- Report Inappropriate Content
Hi
U can try below scripts...
RawData:
LOAD * INLINE [
Date, Stock, Mutations
20-06-2013, 70, 0
12-06-2013, 75, -5
06-06-2013, 76, -1
03-06-2013, 77, -1
12-04-2013, 12, 65
05-03-2013, 14, -2
15-02-2013, 16, -2
13-02-2013, 21, -5
30-01-2013, 27, -6
11-01-2013, 30, -3
];
Data:
Load
Date,
Ltrim(Date(Date#(Date,'DD-MM-YYYY'),'DD/MM/YYYY')) as TRANDATE,
Stock, Mutations
Resident RawData; DROP Table RawData;
NewData:
Load
Date,TRANDATE,
Right(Date(Date#(TRANDATE,'DD/MM/YYYY'),'YYYY MMM'),3) as Month,
Stock, Mutations
Resident Data; DROP Table Data;
Regards-Bika
- Mark as New
- Bookmark
- Subscribe
- Mute
- Subscribe to RSS Feed
- Permalink
- Report Inappropriate Content
Thanks for all the responses. Im almost there.
One thing, i want to total the:
=FirstSortedValue( Stock, -Date)
How can i achieve this? Sum(=FirstSortedValue( Stock, -Date)) does not work.
=FirstSortedValue( aggr(sum(Stock),Date), aggr( -Date,Date) ) only works for the latest values, but earlier dates get really big numbers
- Mark as New
- Bookmark
- Subscribe
- Mute
- Subscribe to RSS Feed
- Permalink
- Report Inappropriate Content
You are still using a chart with dimension Month?
Try
=sum(aggr( FirstSortedValue( aggr(sum(Stock),Date), aggr(-Date, Date) ), Month))
- Mark as New
- Bookmark
- Subscribe
- Mute
- Subscribe to RSS Feed
- Permalink
- Report Inappropriate Content
Yes I am. and =FirstSortedValue( Stock, -Date) works perfect to get the correct stock on a certain date, for each article.
but i want all the articles combined so I have a total. (so a month total of all stock)
Last one is same result as before btw. most recent date is correct (the total) but month earlier it starts to be different
- Mark as New
- Bookmark
- Subscribe
- Mute
- Subscribe to RSS Feed
- Permalink
- Report Inappropriate Content
I compared the values of the totals.
June
Result:33.325
What it should be: 33.325
May
Result: 2.440
What it should be: 25.903
April
Result: 14.552
What is should be: 27.969
March
Result: 105.659
What is should be: 31.689
I'll continue this in another discussion