Unlock a world of possibilities! Login now and discover the exclusive benefits awaiting you.
- Qlik Community
- :
- All Forums
- :
- QlikView App Dev
- :
- Re: Is it possible to select one chart in a contai...
- Subscribe to RSS Feed
- Mark Topic as New
- Mark Topic as Read
- Float this Topic for Current User
- Bookmark
- Subscribe
- Mute
- Printer Friendly Page
- Mark as New
- Bookmark
- Subscribe
- Mute
- Subscribe to RSS Feed
- Permalink
- Report Inappropriate Content
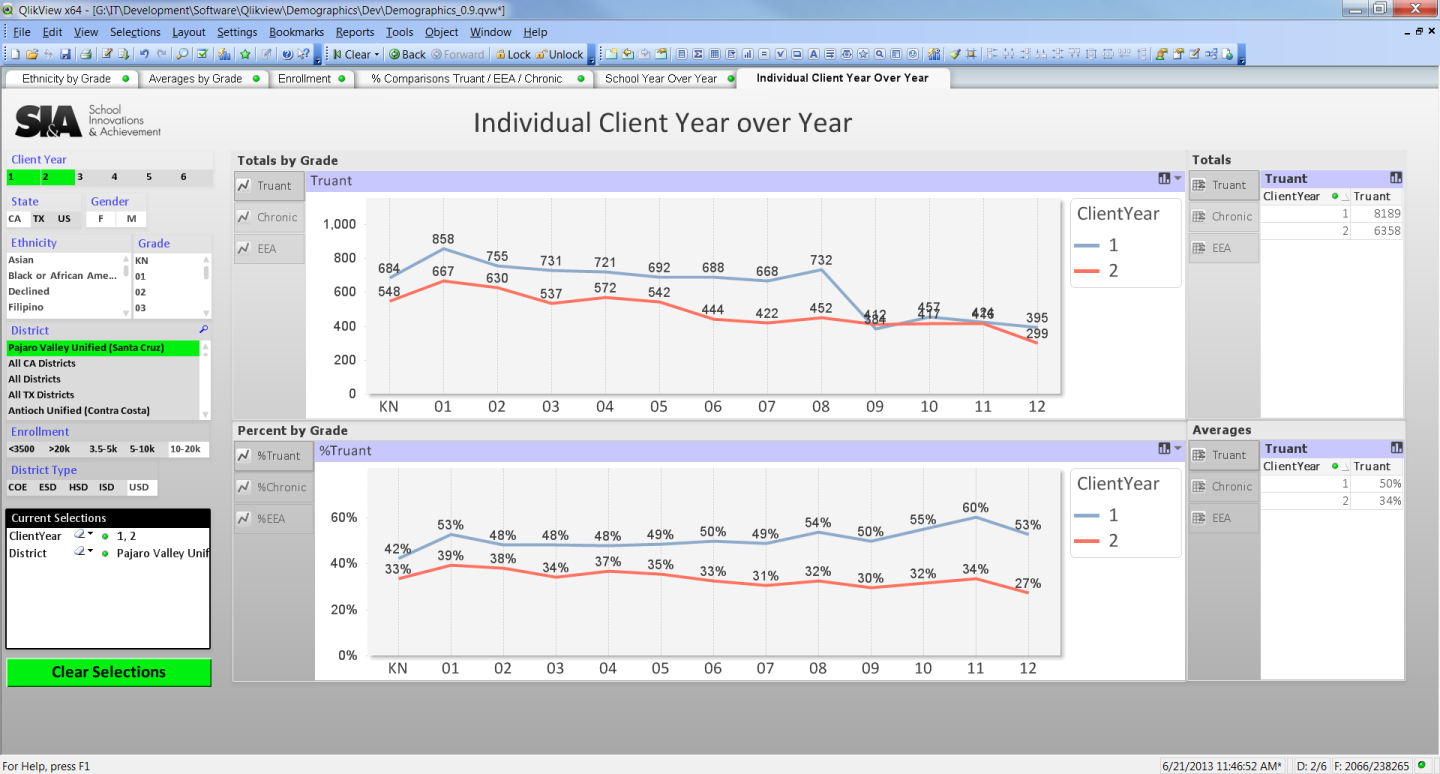
Is it possible to select one chart in a container, and have its corresponding type chart display in a container next to it?
Hi All,
New to QV development, and was wondering if there is any way to select one chart in a container and have that selection affect which chart displays in other containers?
Take a quick look at the screenshot example, if you would... Right now I have my 'Truant' charts displaying in each of my 4 containers.
In order to view my 'Chronic' or my 'EEA' charts, I have to go around to each container and click on the right chart in it.
I would like to just click once somewhere and have it update the type of chart displayed in each of the containers. Is this possible? And if so, how would I do it? Thanks in advance..
Accepted Solutions
- Mark as New
- Bookmark
- Subscribe
- Mute
- Subscribe to RSS Feed
- Permalink
- Report Inappropriate Content
Hi,
Sure there's a way to do that.
You can use buttons to display your reports instead of containers.
You'll also need 1 variable that you'll use in the conditional show property of the charts, let's say vShow.
Triggering any of the buttons will set the related variable value and thus displaying only the related charts.
For example in your case, create 3 buttons: Truant, Chronic and EEA.
In their properties, go to Actions > Add > External > Set Variable.
Type in the variable field vShow and in the Value field type Truant (then Chronic for the 2nd button and EEA for the 3rd).
Now in each of the charts, go to their properties > Layout > Show > Conditional.
Type: Match(vShow, 'Truant'), etc...
That's it ! 
- Mark as New
- Bookmark
- Subscribe
- Mute
- Subscribe to RSS Feed
- Permalink
- Report Inappropriate Content
Hi,
Sure there's a way to do that.
You can use buttons to display your reports instead of containers.
You'll also need 1 variable that you'll use in the conditional show property of the charts, let's say vShow.
Triggering any of the buttons will set the related variable value and thus displaying only the related charts.
For example in your case, create 3 buttons: Truant, Chronic and EEA.
In their properties, go to Actions > Add > External > Set Variable.
Type in the variable field vShow and in the Value field type Truant (then Chronic for the 2nd button and EEA for the 3rd).
Now in each of the charts, go to their properties > Layout > Show > Conditional.
Type: Match(vShow, 'Truant'), etc...
That's it !
- Mark as New
- Bookmark
- Subscribe
- Mute
- Subscribe to RSS Feed
- Permalink
- Report Inappropriate Content
This is a way to go.
I'd suggest one more step. Instead of creating three sets of conditional chart, create only one set, always visible, but with conditional expressions. The fewer objects are in the application, the easier to maintain, lesser risk to overlook hidden objects.
Regards,
Michael
- Mark as New
- Bookmark
- Subscribe
- Mute
- Subscribe to RSS Feed
- Permalink
- Report Inappropriate Content
Indeed Michael 
If it's the same set of charts that's implemented for the 3 cases, then conditional expressions are the solution.
In case additional reports will be displayed only for one of the cases then the conditional show may prove useful.
- Mark as New
- Bookmark
- Subscribe
- Mute
- Subscribe to RSS Feed
- Permalink
- Report Inappropriate Content
Brilliant, thanks so much! This community is pretty awesome
- Mark as New
- Bookmark
- Subscribe
- Mute
- Subscribe to RSS Feed
- Permalink
- Report Inappropriate Content
This QlikView paper also has some useful ideas. Option 2 may be appropraite.
- Mark as New
- Bookmark
- Subscribe
- Mute
- Subscribe to RSS Feed
- Permalink
- Report Inappropriate Content
This solution is now working for me, but I thought I'd leave this comment here for any other newbies who stumble onto this page.
There was one step missing from jp's instructions, probably because it seemed like a given.
However, being so new to QV dev (and not having adequate training), I was unable to get this solution to work until I did one more step:
Settings > Document Properties > Variables > New...
I needed to create the variable 'vShow' before I could use it. Obvious in hindsight, but I hadn't been introduced to variables yet.