Unlock a world of possibilities! Login now and discover the exclusive benefits awaiting you.
- Qlik Community
- :
- All Forums
- :
- QlikView App Dev
- :
- Find minimum value based on minimum date per line
- Subscribe to RSS Feed
- Mark Topic as New
- Mark Topic as Read
- Float this Topic for Current User
- Bookmark
- Subscribe
- Mute
- Printer Friendly Page
- Mark as New
- Bookmark
- Subscribe
- Mute
- Subscribe to RSS Feed
- Permalink
- Report Inappropriate Content
Find minimum value based on minimum date per line
I have a straight table of orders. For each order there is a series of changes in a seperate file. I want to show the minimum quantity change for the minimum change date in the change file. The table's primary dimension is the order number, which is the key.
min({$<OCD={$(=min(OCD))}>}OldQty)
-where OCD is the change date in a numeric form-
This Expression works only sometimes and mostly gives null. But if I select a specific order number it works fine. It doesn't make sense to me since there is only one order number and it is the dimension for the chart. Am I missing something in the set analysis?
- Mark as New
- Bookmark
- Subscribe
- Mute
- Subscribe to RSS Feed
- Permalink
- Report Inappropriate Content
The set is calculated once for the entire chart, not per row, i.e. per order number. You'll need an if statement instead.
And you have nulls in your data. Those can cause your expressions to return nulls too. See this selection:
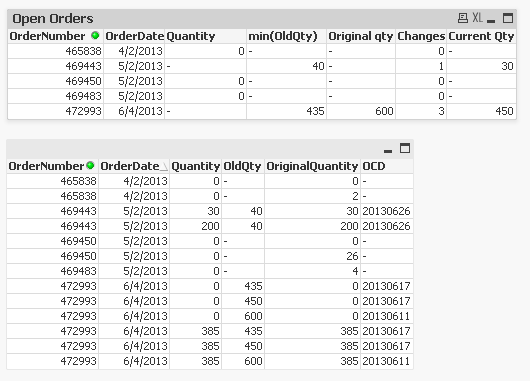
The Quantity column contains nulls because you didn't specify an aggregation function. Therefore the only() function is used and that returns null if there is more than only value. OldQty has nulls for some order numbers so null is returned for those orders. OCD also contains nulls for some orders.
Can you explain what the correct results should be and why?
talk is cheap, supply exceeds demand
- Mark as New
- Bookmark
- Subscribe
- Mute
- Subscribe to RSS Feed
- Permalink
- Report Inappropriate Content
I see. I tried a few like
=min(if(OCD = min(OCD),OldQty))
=if(OCD = min(OCD), min(OldQty))
but none of them were correct, I don't see how else I could use an If statement to get the result
- Mark as New
- Bookmark
- Subscribe
- Mute
- Subscribe to RSS Feed
- Permalink
- Report Inappropriate Content
I found a way around it by concatenating the quantity to the end of the date, finding the min, and using right() to get the quantity.
I was trying to find the minimum oldqty from the minimum date for each order number.