Unlock a world of possibilities! Login now and discover the exclusive benefits awaiting you.
- Qlik Community
- :
- All Forums
- :
- QlikView App Dev
- :
- Re: Continuous Axis with grouping over minute step...
- Subscribe to RSS Feed
- Mark Topic as New
- Mark Topic as Read
- Float this Topic for Current User
- Bookmark
- Subscribe
- Mute
- Printer Friendly Page
- Mark as New
- Bookmark
- Subscribe
- Mute
- Subscribe to RSS Feed
- Permalink
- Report Inappropriate Content
Continuous Axis with grouping over minute step(20 min)
Hi everyone ,
I have a field in which there are no of minutes between 0 and 1635702, A category which have two elements (Screened, Incomplete Screen) , I want following output
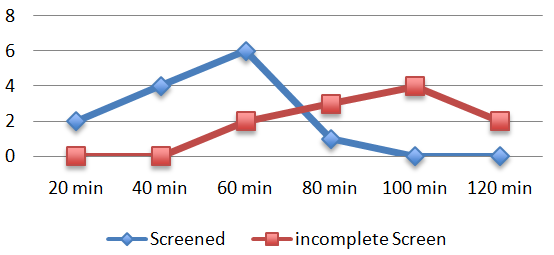
Expression is just count(1) , While interval is of 20 min so this chart will show data points after every 20 min and will count no of records whose minutes are between lower point and upper point e.g. ( between 0 and 20 , between 20 and 40)
How can I get this output in qlikview?
- Mark as New
- Bookmark
- Subscribe
- Mute
- Subscribe to RSS Feed
- Permalink
- Report Inappropriate Content
Have you tried the CLASS() function? Even you can make it as a dynamic interval using variables. To use this way you should use dynamic dimensions and you can also implement more complex conditions.