Unlock a world of possibilities! Login now and discover the exclusive benefits awaiting you.
- Qlik Community
- :
- Discover
- :
- About
- :
- Water Cooler
- :
- Re: Set Analysis Challenge
- Subscribe to RSS Feed
- Mark Topic as New
- Mark Topic as Read
- Float this Topic for Current User
- Bookmark
- Subscribe
- Mute
- Printer Friendly Page
- Mark as New
- Bookmark
- Subscribe
- Mute
- Subscribe to RSS Feed
- Permalink
- Report Inappropriate Content
Set Analysis Challenge
Hello Guys,
I have a table , with Country as a Dimension, and two metrics : Value2 and Value3.
My table looks like this :
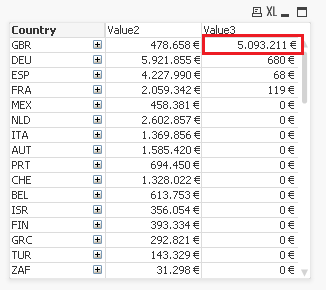
I'd like to put the Value3 for GBR in all the other Countries. Is there any way to do it by set Analysis?
Many thanks in advance.
Regards, Marcel.
- Mark as New
- Bookmark
- Subscribe
- Mute
- Subscribe to RSS Feed
- Permalink
- Report Inappropriate Content
Hi Marcel
If I have understood you correctly I think you want to place the value of 5093.211 in all the rows in Value 3 e.g.
| Country | Value2 | Value3 | Desired Value 3 |
| GBR | 478.658 | 5093.211 | 5093.211 |
| DEU | 5921.855 | 680 | 5093.211 |
| ESP | 4227.89 | 68 | 5093.211 |
| FRA | 2059.342 | 119 | 5093.211 |
One way to do this is to use the field value and field index functions.
FieldIndex will detect the row in which the GBR value exists. Field value will call the value of Value 3 when Country is GBR.
The expression to do this is:
=Sum(FieldValue('Value3',FieldIndex('Country','GBR')))
This will generate a value in each row which you could use to e.g. compare each country's figure with that of GBR.
e.g.
=Sum(Value3)-Sum(FieldValue('Value3',FieldIndex('Country','GBR')))
Hope that helps.
Kind regards
Steve
- Mark as New
- Bookmark
- Subscribe
- Mute
- Subscribe to RSS Feed
- Permalink
- Report Inappropriate Content
Yes, that's what I want to do. I'm trying to do it like you do. But I can't.
Coud you attach a dummy example?
Many thanks in advance Steven.
- Mark as New
- Bookmark
- Subscribe
- Mute
- Subscribe to RSS Feed
- Permalink
- Report Inappropriate Content
GBR-Value3
=Sum(FieldValue('Value3',FieldIndex('Country','GBR')))-Sum(Value3)
=Sum(FieldValue('Value3',FieldIndex('Country','GBR')))-Sum(Value2)
num(
Sum(Value2)
/Sum(FieldValue('Value3',FieldIndex('Country','GBR')))
,'0.00%')
| Country | Value2 | Value3 | GBR Value3 | GBR-Value3 | GBR-Value2 | % of GBR |
| GBR | 478.658 | 5093.211 | 5093.211 | 0 | 4614.553 | 9.40% |
| DEU | 5921.855 | 680 | 5093.211 | 4413.211 | -828.644 | 116.27% |
| ESP | 4227.89 | 68 | 5093.211 | 5025.211 | 865.321 | 83.01% |
| FRA | 2059.342 | 119 | 5093.211 | 4974.211 | 3033.869 | 40.43% |
- Mark as New
- Bookmark
- Subscribe
- Mute
- Subscribe to RSS Feed
- Permalink
- Report Inappropriate Content
Wow! That's amazing Steven,
Now I see why it doesn't work for me.
My problem is that I have a complex model.
I have Dimension1, ...., DimensionN and Metric1,...,MetricN.
and my sum(Value3) looks like sum( {$< Value1={'1'}, Value2 ={'2'} >} Value3).
Maybe the clue is to get an unique key with Dimension1&'-'&Dimension2&'-'&.....&DimensionN as link.
and get as well an unique value per each unique dimension.
- Mark as New
- Bookmark
- Subscribe
- Mute
- Subscribe to RSS Feed
- Permalink
- Report Inappropriate Content
As a general approach, I would use:
=sum({<Country={GBR}>}TOTAL Value3)
TOTAL escapes the dimension you are in, Combining that with what you posted above it would be:
sum( {$< Value1={'1'}, Value2 ={'2'}, Country={GBR} >} TOTAL Value3).
-Rob
- Mark as New
- Bookmark
- Subscribe
- Mute
- Subscribe to RSS Feed
- Permalink
- Report Inappropriate Content
in Value3 write this expression--
if(Country<>'GBR','5.093.211E',Value3)
- Mark as New
- Bookmark
- Subscribe
- Mute
- Subscribe to RSS Feed
- Permalink
- Report Inappropriate Content
Nice approach Rob,
now it looks like this :
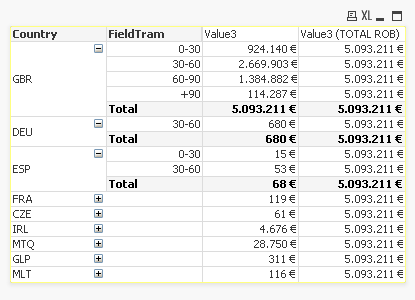
I need to be divided by "FieldTram" as well, and it must be selected by year, month and another temporal values.
Many thanks for your help Rob. I almost got it.
Regards, Marcel.