Unlock a world of possibilities! Login now and discover the exclusive benefits awaiting you.
- Qlik Community
- :
- All Forums
- :
- QlikView App Dev
- :
- Re: Line chart (stacked area's as Style) - empty (...
- Subscribe to RSS Feed
- Mark Topic as New
- Mark Topic as Read
- Float this Topic for Current User
- Bookmark
- Subscribe
- Mute
- Printer Friendly Page
- Mark as New
- Bookmark
- Subscribe
- Mute
- Subscribe to RSS Feed
- Permalink
- Report Inappropriate Content
Line chart (stacked area's as Style) - empty (no-data) area is filled up
Hi,
While using the quite illustrative option in Style for a line chart to show the lines as filled up area's on top of each other (in line chart, properties, Style - the lower two options), I run in to the problem that QlikView seems to 'fill up' area between two points while there is actually no data at all (nothing to present).
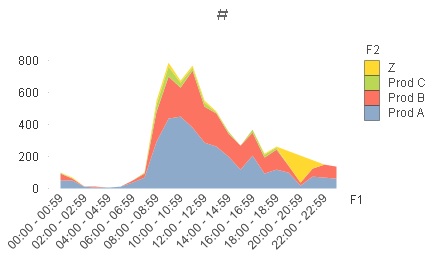
To be more precise, I show a time dimension (timebands in this case) on the x-axis, and count over a dimension existing of four distinct fields. Once there is a period for which the 'top sorted dimension', Z in the described example, does not exist, QlikView fills up an area (Yellow in this case) while there is nothing to show. However, Prod C in the example has also no-existing periods but is shown correctly, and the same if you alter the sort order.
Seems to be a bug. Can anyone help me?
Regards,
- Mark as New
- Bookmark
- Subscribe
- Mute
- Subscribe to RSS Feed
- Permalink
- Report Inappropriate Content
Can you please Explain in details what you want exact ? If there is data problem you need to sort it first.
If the issue is solved please mark the answer with Accept as Solution & like it.
If you want to go quickly, go alone. If you want to go far, go together.
- Mark as New
- Bookmark
- Subscribe
- Mute
- Subscribe to RSS Feed
- Permalink
- Report Inappropriate Content
There is no data problem - for the timebands described there are just no counts (transactions in this case) for certain period. The data is delivered per transaction with a number of fields (e.g. timebands). If there is no transaction on, in this case, Z for a certain timeband there will simply be no line (data). However you plot dimension fields over the timebands, therefore there will be a missing symbol.
The problem is then the yellow area on the right of the image below (also shown in the example), an area is filled up while actually there shouldn't be any counts shown at all for this period (as there are none).
- Mark as New
- Bookmark
- Subscribe
- Mute
- Subscribe to RSS Feed
- Permalink
- Report Inappropriate Content
Reported as a bug and accepted in this thread